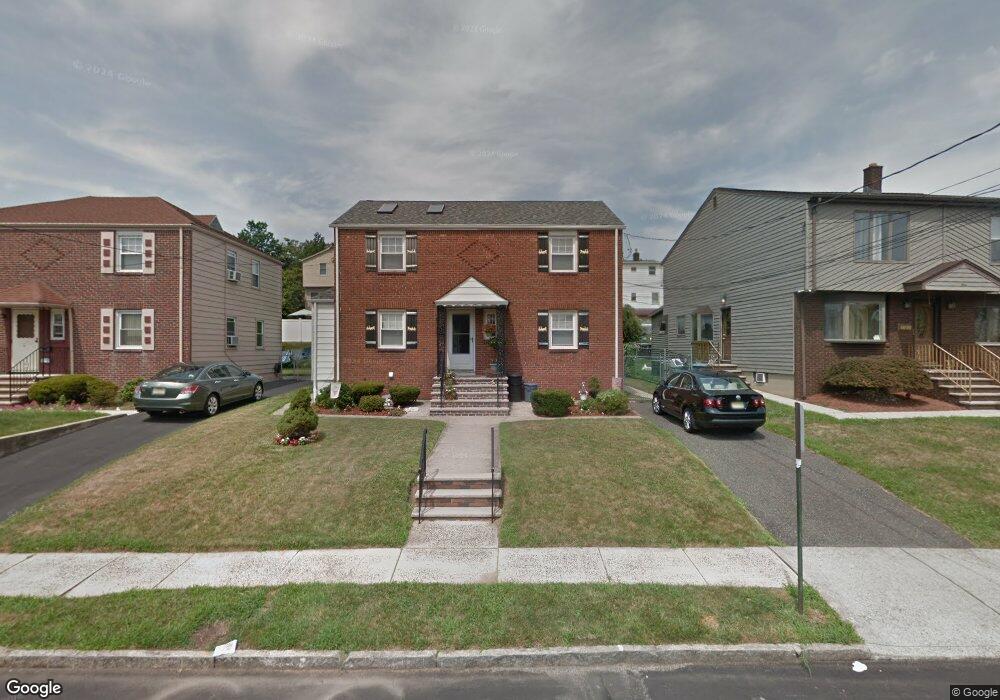
3 2nd St North Arlington, NJ 07031
Estimated Value: $680,161 - $820,000
--
Bed
--
Bath
1,620
Sq Ft
$461/Sq Ft
Est. Value
About This Home
This home is located at 3 2nd St, North Arlington, NJ 07031 and is currently estimated at $747,540, approximately $461 per square foot. 3 2nd St is a home located in Bergen County with nearby schools including North Arlington Middle School, North Arlington High School, and Sacred Heart School.
Ownership History
Date
Name
Owned For
Owner Type
Purchase Details
Closed on
Feb 16, 2021
Sold by
Amato Radil Irene
Bought by
Garcia Irbin Humberto and Zuniga Maria F
Current Estimated Value
Home Financials for this Owner
Home Financials are based on the most recent Mortgage that was taken out on this home.
Original Mortgage
$549,857
Interest Rate
2.7%
Mortgage Type
FHA
Purchase Details
Closed on
Nov 4, 2003
Sold by
Field Kevin
Bought by
Amato Irene
Home Financials for this Owner
Home Financials are based on the most recent Mortgage that was taken out on this home.
Original Mortgage
$296,000
Interest Rate
6.09%
Purchase Details
Closed on
Oct 30, 1998
Sold by
Cocuzza Peter
Bought by
Field Kevin M
Home Financials for this Owner
Home Financials are based on the most recent Mortgage that was taken out on this home.
Original Mortgage
$202,500
Interest Rate
6.75%
Mortgage Type
Purchase Money Mortgage
Create a Home Valuation Report for This Property
The Home Valuation Report is an in-depth analysis detailing your home's value as well as a comparison with similar homes in the area
Home Values in the Area
Average Home Value in this Area
Purchase History
| Date | Buyer | Sale Price | Title Company |
|---|---|---|---|
| Garcia Irbin Humberto | $560,000 | Chicago Title Insurance Co | |
| Garcia Irbin Humberto | $560,000 | Chicago Title Insurance Compan | |
| Amato Irene | $370,000 | -- | |
| Field Kevin M | $225,000 | -- |
Source: Public Records
Mortgage History
| Date | Status | Borrower | Loan Amount |
|---|---|---|---|
| Previous Owner | Garcia Irbin Humberto | $549,857 | |
| Previous Owner | Amato Irene | $296,000 | |
| Previous Owner | Field Kevin M | $202,500 |
Source: Public Records
Tax History Compared to Growth
Tax History
| Year | Tax Paid | Tax Assessment Tax Assessment Total Assessment is a certain percentage of the fair market value that is determined by local assessors to be the total taxable value of land and additions on the property. | Land | Improvement |
|---|---|---|---|---|
| 2025 | $12,303 | $576,400 | $251,500 | $324,900 |
| 2024 | $11,978 | $534,000 | $237,500 | $296,500 |
| 2023 | $11,688 | $490,500 | $222,500 | $268,000 |
| 2022 | $11,688 | $454,600 | $200,000 | $254,600 |
| 2021 | $10,622 | $379,100 | $185,000 | $194,100 |
| 2020 | $10,256 | $372,400 | $182,500 | $189,900 |
| 2019 | $10,247 | $356,900 | $180,000 | $176,900 |
| 2018 | $10,211 | $350,400 | $177,500 | $172,900 |
| 2017 | $10,059 | $344,000 | $175,000 | $169,000 |
| 2016 | $10,174 | $328,300 | $170,000 | $158,300 |
| 2015 | $9,892 | $328,300 | $170,000 | $158,300 |
| 2014 | $9,478 | $328,300 | $170,000 | $158,300 |
Source: Public Records
Map
Nearby Homes