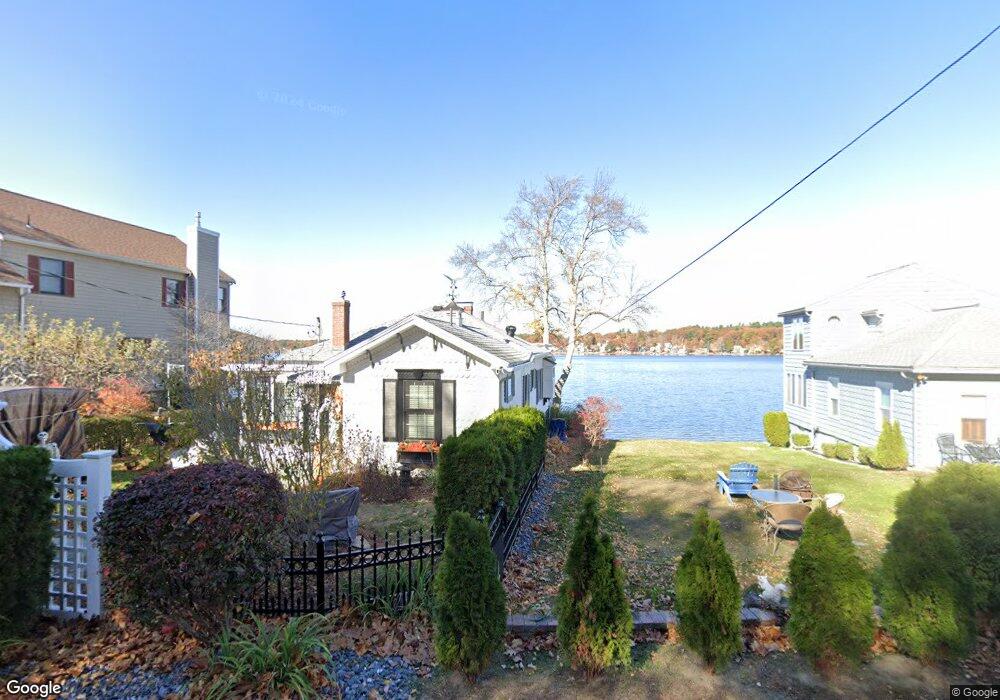
3 5th St Amesbury, MA 01913
Estimated Value: $610,000 - $705,571
4
Beds
3
Baths
1,994
Sq Ft
$329/Sq Ft
Est. Value
About This Home
This home is located at 3 5th St, Amesbury, MA 01913 and is currently estimated at $655,893, approximately $328 per square foot. 3 5th St is a home located in Essex County with nearby schools including Amesbury High School.
Ownership History
Date
Name
Owned For
Owner Type
Purchase Details
Closed on
Apr 21, 2024
Sold by
Pace Alfred T
Bought by
Alfred T Pace Prop T and Pace
Current Estimated Value
Purchase Details
Closed on
Apr 1, 2013
Sold by
Pace Alfred T and Pace Josephine
Bought by
Pace 2Nd Alfred T
Purchase Details
Closed on
May 3, 2011
Sold by
Pace Alfred T and Pace Josephine
Bought by
Deagle Debra and Pace Alfred T
Purchase Details
Closed on
Feb 4, 2010
Sold by
Pace Alfred T and Pace Josephine
Bought by
Pace-Tucker Lisa and Deagle Debra
Create a Home Valuation Report for This Property
The Home Valuation Report is an in-depth analysis detailing your home's value as well as a comparison with similar homes in the area
Home Values in the Area
Average Home Value in this Area
Purchase History
| Date | Buyer | Sale Price | Title Company |
|---|---|---|---|
| Alfred T Pace Prop T | -- | None Available | |
| Alfred T Pace Prop T | -- | None Available | |
| Pace 2Nd Alfred T | -- | -- | |
| Pace 2Nd Alfred T | -- | -- | |
| Deagle Debra | -- | -- | |
| Deagle Debra | -- | -- | |
| Pace-Tucker Lisa | -- | -- | |
| Pace-Tucker Lisa | -- | -- |
Source: Public Records
Mortgage History
| Date | Status | Borrower | Loan Amount |
|---|---|---|---|
| Previous Owner | Pace-Tucker Lisa | $160,000 |
Source: Public Records
Tax History
| Year | Tax Paid | Tax Assessment Tax Assessment Total Assessment is a certain percentage of the fair market value that is determined by local assessors to be the total taxable value of land and additions on the property. | Land | Improvement |
|---|---|---|---|---|
| 2025 | $9,598 | $627,300 | $400,100 | $227,200 |
| 2024 | $7,818 | $499,900 | $303,100 | $196,800 |
| 2023 | $6,291 | $434,600 | $249,600 | $185,000 |
| 2022 | $6,335 | $403,700 | $234,000 | $169,700 |
| 2021 | $7,508 | $383,000 | $208,000 | $175,000 |
| 2020 | $6,924 | $370,600 | $208,000 | $162,600 |
| 2019 | $6,400 | $301,200 | $178,700 | $122,500 |
| 2018 | $6,498 | $246,700 | $170,200 | $76,500 |
| 2017 | $6,276 | $242,800 | $170,200 | $72,600 |
| 2016 | $5,342 | $263,400 | $184,400 | $79,000 |
| 2015 | $5,326 | $259,300 | $184,400 | $74,900 |
| 2014 | $5,314 | $253,400 | $184,400 | $69,000 |
Source: Public Records
Map
Nearby Homes
Your Personal Tour Guide
Ask me questions while you tour the home.