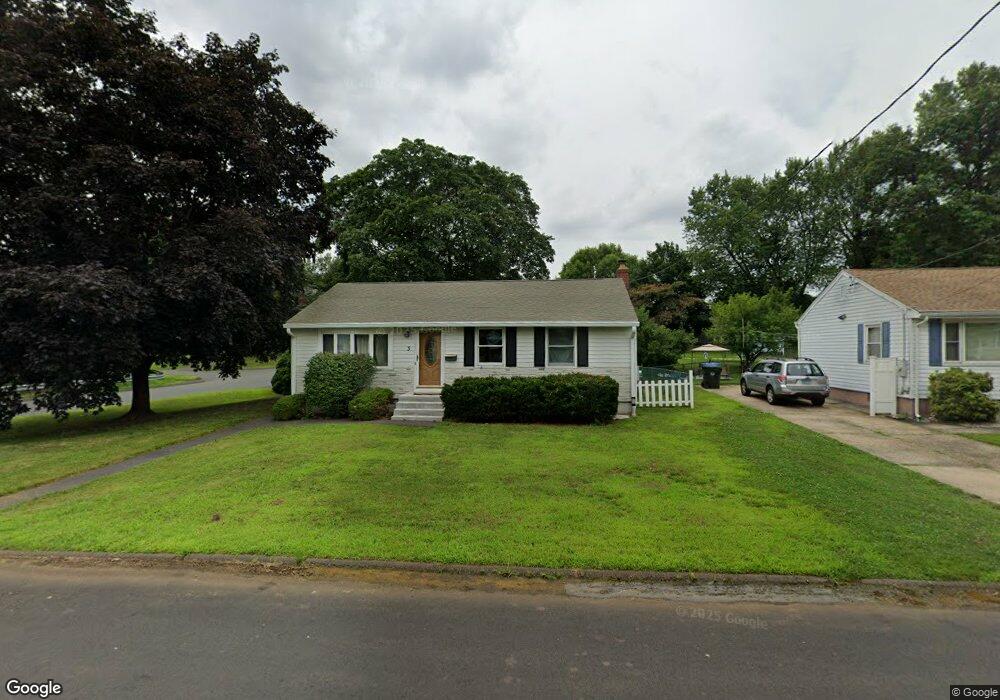
3 6th St Newington, CT 06111
Estimated Value: $237,000 - $298,000
3
Beds
1
Bath
912
Sq Ft
$301/Sq Ft
Est. Value
About This Home
This home is located at 3 6th St, Newington, CT 06111 and is currently estimated at $274,964, approximately $301 per square foot. 3 6th St is a home located in Hartford County with nearby schools including Anna Reynolds School, Martin Kellogg Middle School, and Newington High School.
Ownership History
Date
Name
Owned For
Owner Type
Purchase Details
Closed on
Apr 23, 2021
Sold by
Norman Leduc Ft
Bought by
Bolduc Guy
Current Estimated Value
Home Financials for this Owner
Home Financials are based on the most recent Mortgage that was taken out on this home.
Original Mortgage
$106,000
Outstanding Balance
$95,575
Interest Rate
3.05%
Mortgage Type
Purchase Money Mortgage
Estimated Equity
$179,389
Purchase Details
Closed on
Mar 21, 2013
Sold by
Leduc Norman
Bought by
Norman Leduc Ft and Allaire Stephen O
Purchase Details
Closed on
Jun 24, 2010
Sold by
Leduc Joyce
Bought by
Leduc Norman
Create a Home Valuation Report for This Property
The Home Valuation Report is an in-depth analysis detailing your home's value as well as a comparison with similar homes in the area
Home Values in the Area
Average Home Value in this Area
Purchase History
| Date | Buyer | Sale Price | Title Company |
|---|---|---|---|
| Bolduc Guy | $200,000 | None Available | |
| Norman Leduc Ft | -- | -- | |
| Leduc Norman | -- | -- |
Source: Public Records
Mortgage History
| Date | Status | Borrower | Loan Amount |
|---|---|---|---|
| Open | Bolduc Guy | $106,000 |
Source: Public Records
Tax History
| Year | Tax Paid | Tax Assessment Tax Assessment Total Assessment is a certain percentage of the fair market value that is determined by local assessors to be the total taxable value of land and additions on the property. | Land | Improvement |
|---|---|---|---|---|
| 2025 | $5,096 | $127,460 | $54,020 | $73,440 |
| 2024 | $5,056 | $127,460 | $54,020 | $73,440 |
| 2023 | $4,889 | $127,460 | $54,020 | $73,440 |
| 2022 | $4,906 | $127,460 | $54,020 | $73,440 |
| 2021 | $4,947 | $127,460 | $54,020 | $73,440 |
| 2020 | $4,689 | $119,370 | $54,020 | $65,350 |
| 2019 | $4,709 | $119,370 | $54,020 | $65,350 |
| 2018 | $4,596 | $119,370 | $54,020 | $65,350 |
| 2017 | $4,368 | $119,370 | $54,020 | $65,350 |
| 2016 | $4,267 | $119,370 | $54,020 | $65,350 |
| 2014 | $3,920 | $112,740 | $54,170 | $58,570 |
Source: Public Records
Map
Nearby Homes
- 116 Sunrise Ave
- 192 Market St
- 77 Thorniley St
- 31 Judd Ave
- 235 Lucille St
- 151 Newington Ave Unit 3A(5)
- 835 East St Unit 837
- 159 Rhodes St
- 255 Chapman St
- 495 New Britain Ave
- 104A Chapman St
- 59 Smalley St
- 108 Belden St
- 1235 East St Unit B
- 561 East St
- 1241 East St Unit C2
- 547 East St
- 42 Connerton St
- 1320 Stanley St
- 50 Long St Unit 5
Your Personal Tour Guide
Ask me questions while you tour the home.