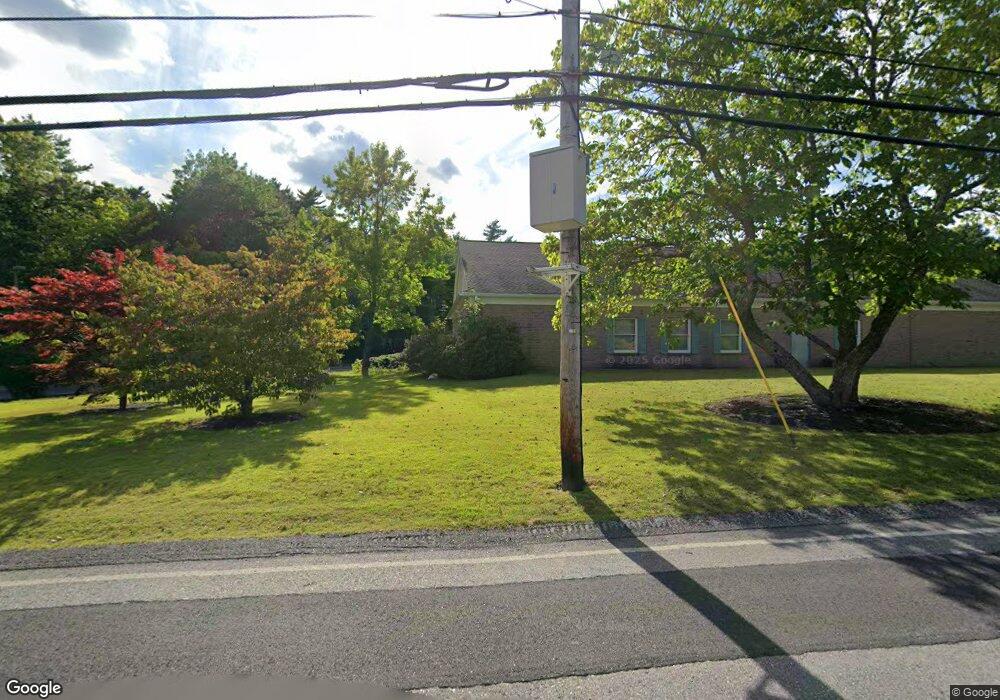
3 Acorn Ave Middleborough, MA 02346
Estimated Value: $513,000 - $827,000
4
Beds
1
Bath
1,001
Sq Ft
$637/Sq Ft
Est. Value
About This Home
This home is located at 3 Acorn Ave, Middleborough, MA 02346 and is currently estimated at $637,374, approximately $636 per square foot. 3 Acorn Ave is a home located in Plymouth County.
Ownership History
Date
Name
Owned For
Owner Type
Purchase Details
Closed on
Oct 5, 2016
Sold by
Steinberg Adria
Bought by
Seidel Adam B and Seidel Samuel S
Current Estimated Value
Purchase Details
Closed on
May 31, 2001
Sold by
Sones Debra A
Bought by
Seidel Steven and Steinberg Adria
Home Financials for this Owner
Home Financials are based on the most recent Mortgage that was taken out on this home.
Original Mortgage
$238,000
Interest Rate
7.09%
Mortgage Type
Purchase Money Mortgage
Purchase Details
Closed on
Dec 14, 1999
Sold by
Ross Rt and Ross Dorothy
Bought by
Sones Debra A
Create a Home Valuation Report for This Property
The Home Valuation Report is an in-depth analysis detailing your home's value as well as a comparison with similar homes in the area
Home Values in the Area
Average Home Value in this Area
Purchase History
| Date | Buyer | Sale Price | Title Company |
|---|---|---|---|
| Seidel Adam B | -- | -- | |
| Seidel Adam B | -- | -- | |
| Steinberg Adria | -- | -- | |
| Steinberg Adria | -- | -- | |
| Seidel Steven | $298,000 | -- | |
| Seidel Steven | $298,000 | -- | |
| Sones Debra A | $155,000 | -- | |
| Sones Debra A | $155,000 | -- |
Source: Public Records
Mortgage History
| Date | Status | Borrower | Loan Amount |
|---|---|---|---|
| Previous Owner | Sones Debra A | $234,000 | |
| Previous Owner | Sones Debra A | $238,000 | |
| Previous Owner | Sones Debra A | $25,000 |
Source: Public Records
Tax History Compared to Growth
Tax History
| Year | Tax Paid | Tax Assessment Tax Assessment Total Assessment is a certain percentage of the fair market value that is determined by local assessors to be the total taxable value of land and additions on the property. | Land | Improvement |
|---|---|---|---|---|
| 2025 | $6,200 | $564,700 | $355,200 | $209,500 |
| 2024 | $5,438 | $465,600 | $253,500 | $212,100 |
| 2023 | $5,188 | $423,500 | $230,500 | $193,000 |
| 2022 | $5,188 | $380,900 | $230,500 | $150,400 |
| 2021 | $5,033 | $359,500 | $230,500 | $129,000 |
| 2020 | $4,852 | $353,900 | $230,500 | $123,400 |
| 2019 | $5,100 | $376,100 | $264,000 | $112,100 |
| 2018 | $4,936 | $351,600 | $264,000 | $87,600 |
| 2017 | $4,901 | $350,600 | $264,000 | $86,600 |
| 2016 | $4,345 | $308,400 | $231,400 | $77,000 |
| 2015 | $4,199 | $306,500 | $231,400 | $75,100 |
| 2014 | $3,801 | $286,000 | $198,300 | $87,700 |
Source: Public Records
Map
Nearby Homes
- 35 Locust St
- 35 Locust St
- 0 Broad St Off Unit 72362523
- 12 Grove St
- 17 Carleton St Unit 17
- 12 Beacon St Unit 84
- 46 Kins Ct
- 3 Crescent Place
- 38 Amos Way
- 26 Highland Ave
- 6 Unit 74
- 9 10th St
- 52 Starboard Dr Unit 36H
- 2 Beacon St Unit 77
- 10 Beacon St Unit 83
- 11 22nd St
- 9 22nd St
- 8 Beacon St Unit 80
- 6 Beacon St Unit 79
- 22 Bay View Ave