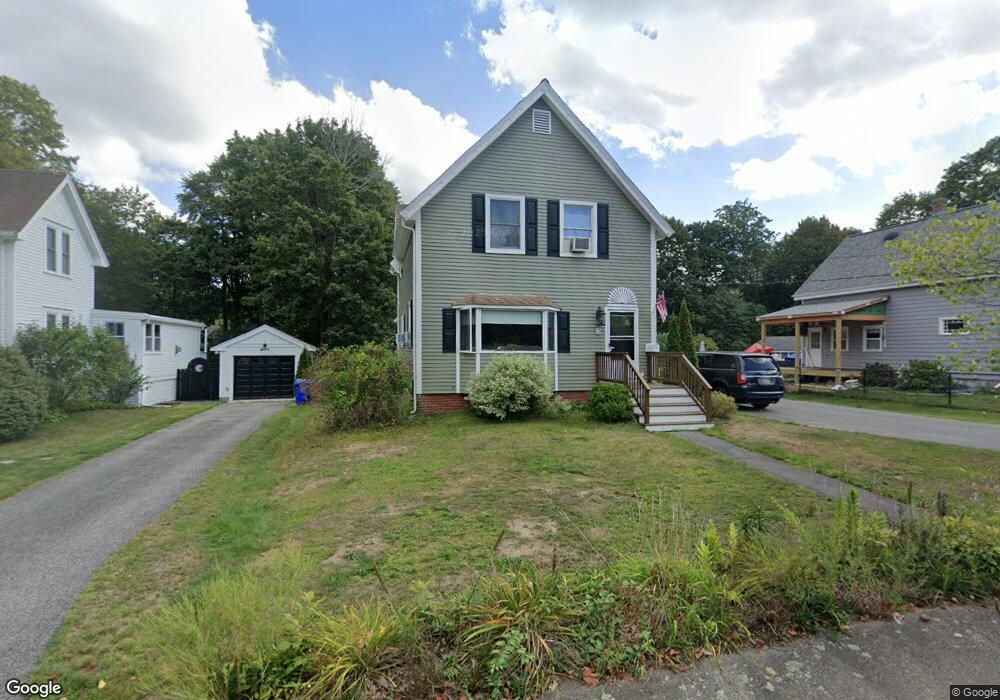
3 Albion Ct Rockland, MA 02370
Estimated Value: $511,000 - $587,000
--
Bed
1
Bath
1,604
Sq Ft
$342/Sq Ft
Est. Value
About This Home
This home is located at 3 Albion Ct, Rockland, MA 02370 and is currently estimated at $549,216, approximately $342 per square foot. 3 Albion Ct is a home located in Plymouth County with nearby schools including Rockland Senior High School, Calvary Chapel Academy, and Holy Family Elementary School.
Ownership History
Date
Name
Owned For
Owner Type
Purchase Details
Closed on
Dec 7, 2020
Sold by
Hall Kenneth W and Hall Joanne E
Bought by
Hall Ft
Current Estimated Value
Purchase Details
Closed on
Oct 3, 1991
Sold by
Ware David R and Ware Cynthia I
Bought by
Hall Kenneth W and Hall Joanne E
Create a Home Valuation Report for This Property
The Home Valuation Report is an in-depth analysis detailing your home's value as well as a comparison with similar homes in the area
Home Values in the Area
Average Home Value in this Area
Purchase History
| Date | Buyer | Sale Price | Title Company |
|---|---|---|---|
| Hall Ft | -- | None Available | |
| Hall Kenneth W | $128,000 | -- |
Source: Public Records
Mortgage History
| Date | Status | Borrower | Loan Amount |
|---|---|---|---|
| Previous Owner | Hall Kenneth W | $185,000 | |
| Previous Owner | Hall Kenneth W | $100,000 | |
| Previous Owner | Hall Kenneth W | $142,000 |
Source: Public Records
Tax History Compared to Growth
Tax History
| Year | Tax Paid | Tax Assessment Tax Assessment Total Assessment is a certain percentage of the fair market value that is determined by local assessors to be the total taxable value of land and additions on the property. | Land | Improvement |
|---|---|---|---|---|
| 2025 | $6,503 | $475,700 | $227,300 | $248,400 |
| 2024 | $6,359 | $452,300 | $214,400 | $237,900 |
| 2023 | $6,316 | $415,000 | $196,700 | $218,300 |
| 2022 | $6,092 | $363,700 | $171,000 | $192,700 |
| 2021 | $5,590 | $323,500 | $155,500 | $168,000 |
| 2020 | $5,392 | $308,100 | $148,100 | $160,000 |
| 2019 | $5,303 | $295,900 | $141,100 | $154,800 |
| 2018 | $5,238 | $287,500 | $141,100 | $146,400 |
| 2017 | $5,088 | $275,300 | $141,100 | $134,200 |
| 2016 | $4,898 | $264,900 | $135,600 | $129,300 |
| 2015 | $4,815 | $253,000 | $126,800 | $126,200 |
| 2014 | $4,554 | $248,300 | $124,300 | $124,000 |
Source: Public Records
Map
Nearby Homes
- 149 Concord St
- 133 Crescent St
- 440 Market St
- 94-96 Crescent St
- 49 Liberty St
- 92 Liberty St
- 38 Levin Rd
- 133 Spring St
- 20 Pat Rose Way
- 19 Pat Rose Way
- 140 W Water St
- 6 Pat Rose Way
- 8 Pat Rose Way
- 17 Pat Rose Way
- 86 Damon Rd
- 50 Linden Park
- 718 Market St
- 225 W Water St
- 45-47 Park St
- 103 Grove St Unit 337