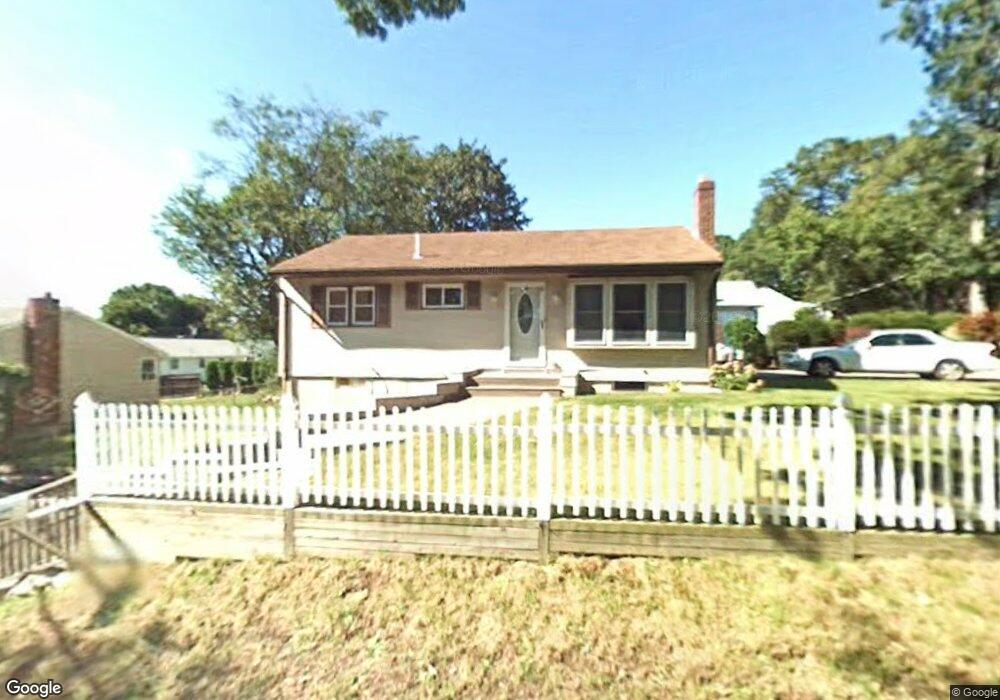
3 Almon Ave Brockton, MA 02301
Estimated Value: $471,000 - $524,000
2
Beds
2
Baths
1,175
Sq Ft
$425/Sq Ft
Est. Value
About This Home
This home is located at 3 Almon Ave, Brockton, MA 02301 and is currently estimated at $499,523, approximately $425 per square foot. 3 Almon Ave is a home located in Plymouth County with nearby schools including Hancock Elementary School, Manthala George Jr. School, and Louis F Angelo Elementary School.
Ownership History
Date
Name
Owned For
Owner Type
Purchase Details
Closed on
Jun 15, 2011
Sold by
Pham Thanh D and Pham Tuan A
Bought by
Pierce Michael J
Current Estimated Value
Home Financials for this Owner
Home Financials are based on the most recent Mortgage that was taken out on this home.
Original Mortgage
$170,000
Outstanding Balance
$117,798
Interest Rate
4.74%
Mortgage Type
Purchase Money Mortgage
Estimated Equity
$381,725
Purchase Details
Closed on
Sep 5, 2001
Sold by
Demello Marie L
Bought by
Pham Tuan A and Pham Thanh D
Home Financials for this Owner
Home Financials are based on the most recent Mortgage that was taken out on this home.
Original Mortgage
$141,550
Interest Rate
7.05%
Mortgage Type
Purchase Money Mortgage
Create a Home Valuation Report for This Property
The Home Valuation Report is an in-depth analysis detailing your home's value as well as a comparison with similar homes in the area
Home Values in the Area
Average Home Value in this Area
Purchase History
| Date | Buyer | Sale Price | Title Company |
|---|---|---|---|
| Pierce Michael J | $215,000 | -- | |
| Pham Tuan A | $155,000 | -- |
Source: Public Records
Mortgage History
| Date | Status | Borrower | Loan Amount |
|---|---|---|---|
| Open | Pierce Michael J | $170,000 | |
| Previous Owner | Pham Tuan A | $141,550 | |
| Previous Owner | Pham Tuan A | $7,500 | |
| Previous Owner | Pham Tuan A | $25,000 |
Source: Public Records
Tax History Compared to Growth
Tax History
| Year | Tax Paid | Tax Assessment Tax Assessment Total Assessment is a certain percentage of the fair market value that is determined by local assessors to be the total taxable value of land and additions on the property. | Land | Improvement |
|---|---|---|---|---|
| 2025 | $5,169 | $426,800 | $143,300 | $283,500 |
| 2024 | $5,014 | $417,100 | $143,300 | $273,800 |
| 2023 | $5,106 | $393,400 | $107,800 | $285,600 |
| 2022 | $4,544 | $325,300 | $97,800 | $227,500 |
| 2021 | $4,528 | $312,300 | $88,600 | $223,700 |
| 2020 | $4,547 | $300,100 | $85,200 | $214,900 |
| 2019 | $4,469 | $287,600 | $77,900 | $209,700 |
| 2018 | $3,816 | $237,600 | $77,900 | $159,700 |
| 2017 | $3,787 | $235,200 | $77,900 | $157,300 |
| 2016 | $3,906 | $225,000 | $74,200 | $150,800 |
| 2015 | $3,655 | $201,400 | $74,200 | $127,200 |
| 2014 | $3,619 | $199,600 | $74,200 | $125,400 |
Source: Public Records
Map
Nearby Homes