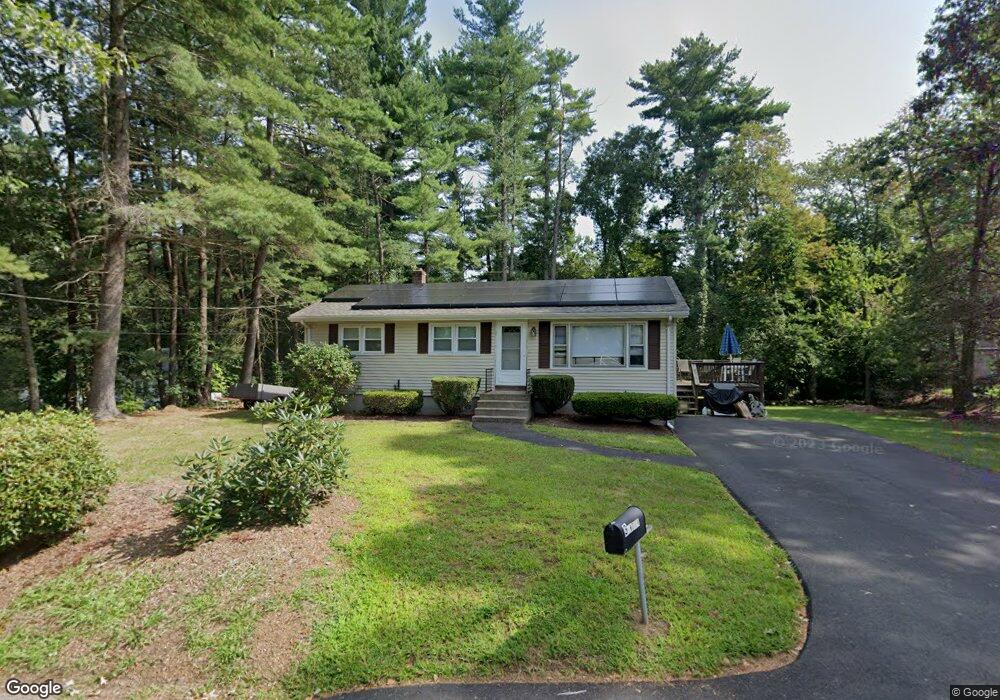
3 Andrew St Bellingham, MA 02019
Estimated Value: $405,000 - $451,000
3
Beds
1
Bath
960
Sq Ft
$444/Sq Ft
Est. Value
About This Home
This home is located at 3 Andrew St, Bellingham, MA 02019 and is currently estimated at $425,937, approximately $443 per square foot. 3 Andrew St is a home located in Norfolk County with nearby schools including Joseph F. DiPietro Elementary, Bellingham High School, and Rise Prep Mayoral Academy Middle School.
Ownership History
Date
Name
Owned For
Owner Type
Purchase Details
Closed on
Sep 14, 1989
Sold by
Parent Fairh M
Bought by
Alarie Raymond J
Current Estimated Value
Home Financials for this Owner
Home Financials are based on the most recent Mortgage that was taken out on this home.
Original Mortgage
$120,600
Interest Rate
9.58%
Mortgage Type
Purchase Money Mortgage
Purchase Details
Closed on
Oct 9, 1987
Sold by
Ssteven R
Bought by
Parent Faith M
Create a Home Valuation Report for This Property
The Home Valuation Report is an in-depth analysis detailing your home's value as well as a comparison with similar homes in the area
Home Values in the Area
Average Home Value in this Area
Purchase History
| Date | Buyer | Sale Price | Title Company |
|---|---|---|---|
| Alarie Raymond J | $134,000 | -- | |
| Parent Faith M | $130,000 | -- |
Source: Public Records
Mortgage History
| Date | Status | Borrower | Loan Amount |
|---|---|---|---|
| Closed | Parent Faith M | $105,000 | |
| Closed | Parent Faith M | $107,100 | |
| Closed | Parent Faith M | $120,600 |
Source: Public Records
Tax History
| Year | Tax Paid | Tax Assessment Tax Assessment Total Assessment is a certain percentage of the fair market value that is determined by local assessors to be the total taxable value of land and additions on the property. | Land | Improvement |
|---|---|---|---|---|
| 2025 | $4,441 | $353,600 | $131,900 | $221,700 |
| 2024 | $4,268 | $331,900 | $120,400 | $211,500 |
| 2023 | $4,115 | $315,300 | $114,700 | $200,600 |
| 2022 | $4,034 | $286,500 | $95,600 | $190,900 |
| 2021 | $3,908 | $271,200 | $95,600 | $175,600 |
| 2020 | $3,628 | $255,100 | $95,600 | $159,500 |
| 2019 | $3,540 | $249,100 | $95,600 | $153,500 |
| 2018 | $3,298 | $228,900 | $96,500 | $132,400 |
| 2017 | $3,205 | $223,500 | $96,500 | $127,000 |
| 2016 | $3,128 | $218,900 | $100,300 | $118,600 |
| 2015 | $3,001 | $210,600 | $96,500 | $114,100 |
| 2014 | $2,985 | $203,600 | $93,100 | $110,500 |
Source: Public Records
Map
Nearby Homes
- 36 Indian Run Rd
- 5 Bernier Ln
- 11 Quail Run Rd
- 0 North St Unit 73440626
- 14 Little Tree Ln
- 66 Newland Ave
- 2 Marie Dr
- 1 Whitman Cir Unit 1
- 5 Whitman Cir Unit 5
- 3 Whitman Cir Unit 3
- 58 Douglas Dr
- 352 Lake St
- 125 Blackstone St
- 183 Elm St Unit 185
- 185 Elm St
- 70 Oswego St
- 67 Blackstone St
- 101 Pine Grove Ave
- 31 S Main St
- 7 Debra Ln Unit 1
- 7 Andrew St
- 47 Scott Hill Blvd
- 37 Scott Hill Blvd
- 11 Andrew St
- 44 Scott Hill Blvd
- 10 Andrew St
- 40 Scott Hill Blvd
- 36 Scott Hill Blvd
- 48 Scott Hill Blvd
- 53 Scott Hill Blvd
- 13 Andrew St
- 30 Scott Hill Blvd
- 50 Scott Hill Blvd
- 12 Andrew St
- 21 Scott Hill Blvd
- 4 Roger St
- 34 Roger St
- 15 Andrew St
- 6 Indian Run Rd
- 32 Roger St
Your Personal Tour Guide
Ask me questions while you tour the home.