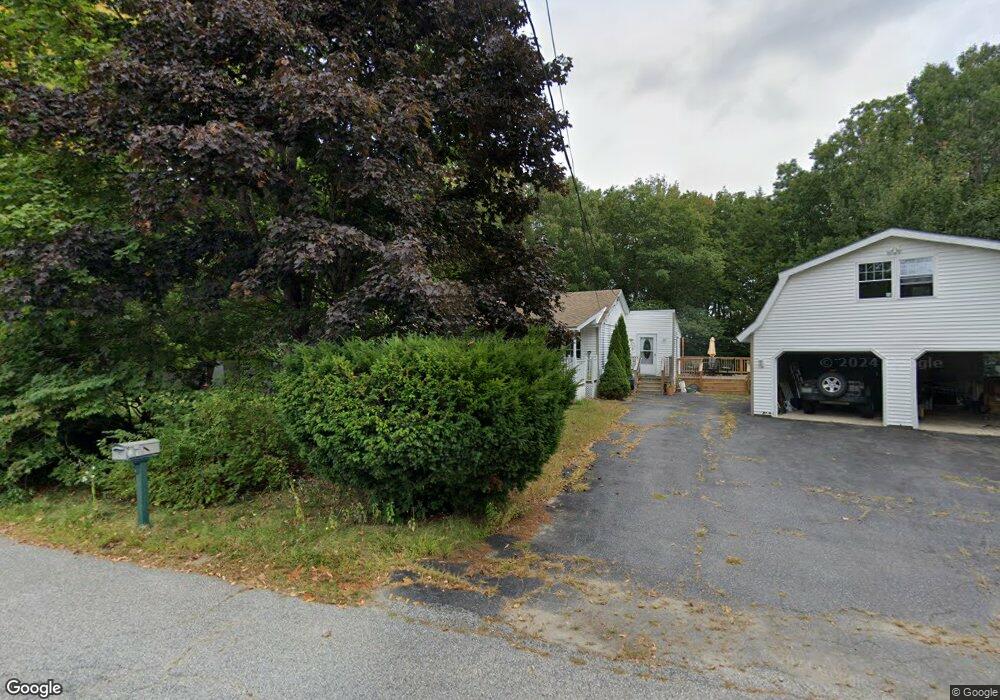
3 Anthony St Lisbon Falls, ME 04252
Estimated Value: $333,000 - $381,000
3
Beds
2
Baths
1,008
Sq Ft
$358/Sq Ft
Est. Value
About This Home
This home is located at 3 Anthony St, Lisbon Falls, ME 04252 and is currently estimated at $361,137, approximately $358 per square foot. 3 Anthony St is a home with nearby schools including Lisbon Community School, Philip W. Sugg Middle School, and Lisbon High School.
Ownership History
Date
Name
Owned For
Owner Type
Purchase Details
Closed on
Nov 10, 2020
Sold by
Stewart Prop Solutions
Bought by
Jones Sandra
Current Estimated Value
Home Financials for this Owner
Home Financials are based on the most recent Mortgage that was taken out on this home.
Original Mortgage
$237,500
Outstanding Balance
$208,428
Interest Rate
2.8%
Mortgage Type
New Conventional
Estimated Equity
$152,709
Purchase Details
Closed on
Jul 8, 2009
Sold by
Gonyou Ronald A
Bought by
Gonyou Gail A
Home Financials for this Owner
Home Financials are based on the most recent Mortgage that was taken out on this home.
Original Mortgage
$110,000
Interest Rate
4.93%
Mortgage Type
Commercial
Create a Home Valuation Report for This Property
The Home Valuation Report is an in-depth analysis detailing your home's value as well as a comparison with similar homes in the area
Home Values in the Area
Average Home Value in this Area
Purchase History
| Date | Buyer | Sale Price | Title Company |
|---|---|---|---|
| Jones Sandra | -- | None Available | |
| Gonyou Gail A | -- | -- |
Source: Public Records
Mortgage History
| Date | Status | Borrower | Loan Amount |
|---|---|---|---|
| Open | Jones Sandra | $237,500 | |
| Previous Owner | Gonyou Gail A | $110,000 |
Source: Public Records
Tax History
| Year | Tax Paid | Tax Assessment Tax Assessment Total Assessment is a certain percentage of the fair market value that is determined by local assessors to be the total taxable value of land and additions on the property. | Land | Improvement |
|---|---|---|---|---|
| 2025 | $5,434 | $315,000 | $62,000 | $253,000 |
| 2024 | $4,386 | $322,500 | $62,000 | $260,500 |
| 2023 | $3,994 | $189,300 | $40,900 | $148,400 |
| 2022 | $4,373 | $189,300 | $40,900 | $148,400 |
| 2021 | $4,184 | $189,300 | $40,900 | $148,400 |
| 2020 | $3,836 | $189,300 | $40,900 | $148,400 |
| 2019 | $3,911 | $189,300 | $40,900 | $148,400 |
| 2018 | $3,609 | $165,300 | $35,600 | $129,700 |
| 2017 | $3,371 | $165,300 | $35,600 | $129,700 |
| 2016 | $3,367 | $165,300 | $35,600 | $129,700 |
| 2015 | $2,902 | $131,700 | $39,500 | $92,200 |
| 2014 | $3,004 | $131,700 | $39,500 | $92,200 |
| 2013 | -- | $131,700 | $39,500 | $92,200 |
Source: Public Records
Map
Nearby Homes
Your Personal Tour Guide
Ask me questions while you tour the home.