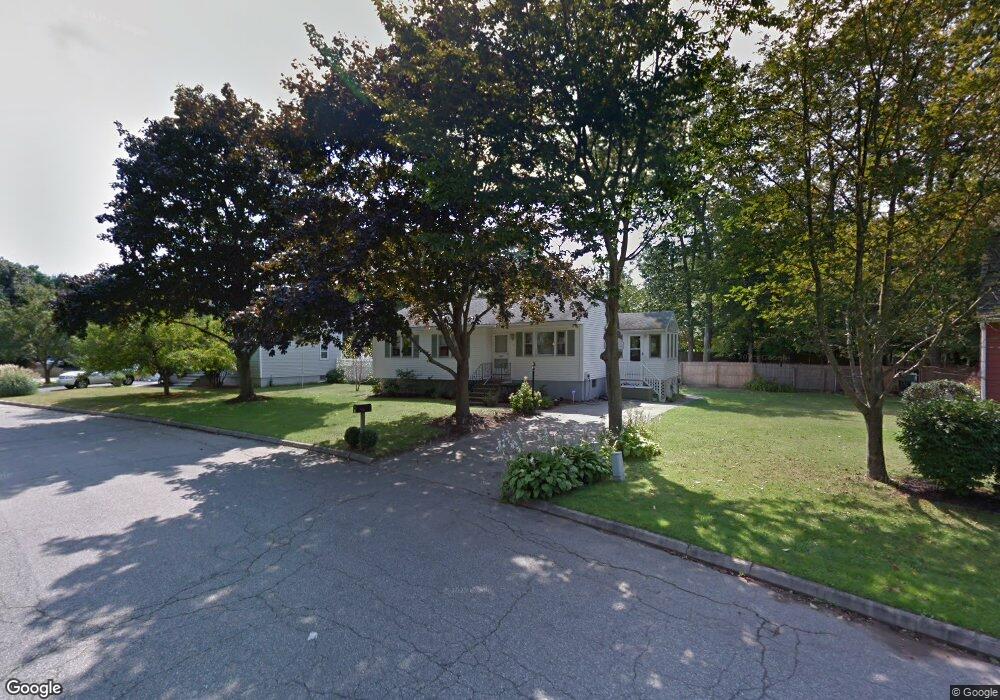
3 Ash St Amesbury, MA 01913
Estimated Value: $525,555 - $665,000
3
Beds
1
Bath
1,008
Sq Ft
$582/Sq Ft
Est. Value
About This Home
This home is located at 3 Ash St, Amesbury, MA 01913 and is currently estimated at $587,139, approximately $582 per square foot. 3 Ash St is a home located in Essex County with nearby schools including Amesbury High School and Amesbury Seventh-Day Adventist School.
Ownership History
Date
Name
Owned For
Owner Type
Purchase Details
Closed on
Sep 5, 2018
Sold by
Cross Dina A and Cross Randy J
Bought by
Cross Dina A
Current Estimated Value
Purchase Details
Closed on
Oct 1, 1999
Sold by
Burdick Homer C
Bought by
Cross Randy J and Cross Dina A
Home Financials for this Owner
Home Financials are based on the most recent Mortgage that was taken out on this home.
Original Mortgage
$155,325
Interest Rate
7.85%
Mortgage Type
Purchase Money Mortgage
Create a Home Valuation Report for This Property
The Home Valuation Report is an in-depth analysis detailing your home's value as well as a comparison with similar homes in the area
Home Values in the Area
Average Home Value in this Area
Purchase History
| Date | Buyer | Sale Price | Title Company |
|---|---|---|---|
| Cross Dina A | -- | -- | |
| Cross Randy J | $163,500 | -- |
Source: Public Records
Mortgage History
| Date | Status | Borrower | Loan Amount |
|---|---|---|---|
| Previous Owner | Cross Randy J | $228,000 | |
| Previous Owner | Cross Randy J | $60,000 | |
| Previous Owner | Cross Randy J | $152,000 | |
| Previous Owner | Cross Randy J | $155,325 |
Source: Public Records
Tax History
| Year | Tax Paid | Tax Assessment Tax Assessment Total Assessment is a certain percentage of the fair market value that is determined by local assessors to be the total taxable value of land and additions on the property. | Land | Improvement |
|---|---|---|---|---|
| 2025 | $6,717 | $439,000 | $209,500 | $229,500 |
| 2024 | $6,337 | $405,200 | $197,600 | $207,600 |
| 2023 | $6,345 | $388,300 | $171,800 | $216,500 |
| 2022 | $6,140 | $347,100 | $149,400 | $197,700 |
| 2021 | $5,778 | $316,600 | $120,400 | $196,200 |
| 2020 | $5,139 | $299,100 | $115,800 | $183,300 |
| 2019 | $5,074 | $276,200 | $115,800 | $160,400 |
| 2018 | $5,342 | $281,300 | $110,300 | $171,000 |
| 2017 | $4,978 | $249,500 | $110,300 | $139,200 |
| 2016 | $4,817 | $237,500 | $110,300 | $127,200 |
| 2015 | $4,661 | $226,900 | $110,300 | $116,600 |
| 2014 | $4,230 | $201,700 | $110,300 | $91,400 |
Source: Public Records
Map
Nearby Homes
- 82 Monroe St
- 3 Birchwood Point Unit 202
- 53 Rabbit Rd
- 7 Birchwood Pointe Unit 101
- 21 River St
- 21 Congress St
- 382 Main St
- 97 Elm St
- 4 Clark St
- 25 Cedar St Unit 4
- 253 Main St
- 4 Greenwood St
- 191 Elm St
- 101 Market St Unit B
- 105 Market St Unit B
- 57 Baker Rd
- 149 Market St
- 1 Hillside Ave Unit 3
- 3 Tremont Ave Unit A
- 48 Orchard St
Your Personal Tour Guide
Ask me questions while you tour the home.