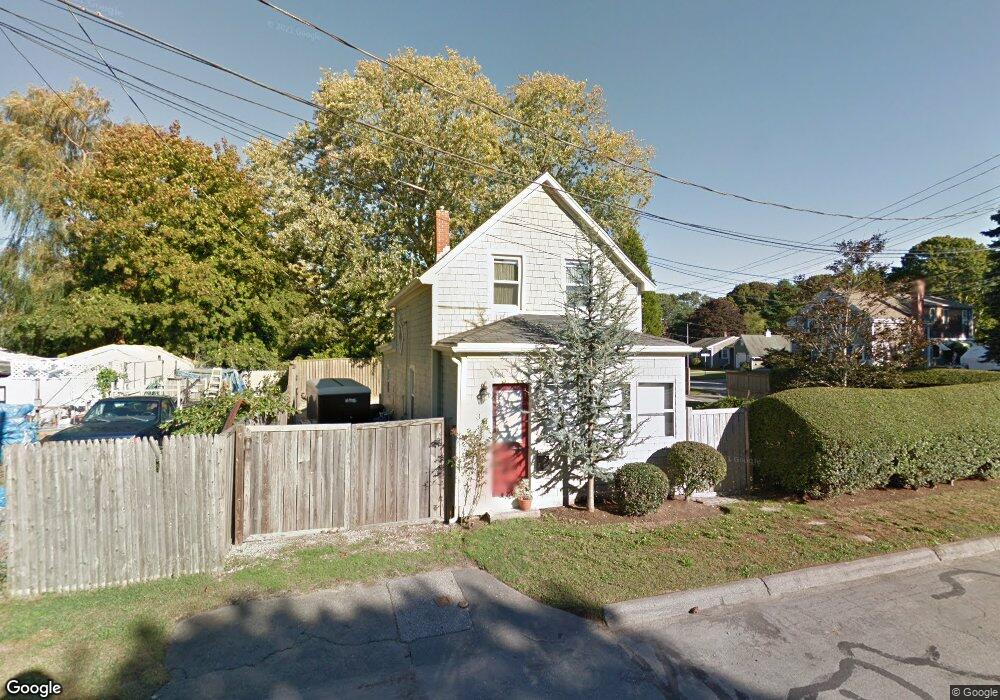
3 Atlas St Fairhaven, MA 02719
Estimated Value: $377,000 - $569,000
1
Bed
1
Bath
803
Sq Ft
$542/Sq Ft
Est. Value
About This Home
This home is located at 3 Atlas St, Fairhaven, MA 02719 and is currently estimated at $435,402, approximately $542 per square foot. 3 Atlas St is a home located in Bristol County with nearby schools including Fairhaven High School, City On A Hill Charter Public School New Bedford, and St. Joseph School.
Ownership History
Date
Name
Owned For
Owner Type
Purchase Details
Closed on
Jan 3, 2025
Sold by
Delano Bruce M
Bought by
Bruce M Delano Ret and Delano
Current Estimated Value
Purchase Details
Closed on
Apr 3, 2000
Sold by
Westgate Eva
Bought by
Delano Bruce M
Create a Home Valuation Report for This Property
The Home Valuation Report is an in-depth analysis detailing your home's value as well as a comparison with similar homes in the area
Home Values in the Area
Average Home Value in this Area
Purchase History
| Date | Buyer | Sale Price | Title Company |
|---|---|---|---|
| Bruce M Delano Ret | -- | None Available | |
| Bruce M Delano Ret | -- | None Available | |
| Delano Bruce M | $25,000 | -- | |
| Delano Bruce M | $25,000 | -- |
Source: Public Records
Mortgage History
| Date | Status | Borrower | Loan Amount |
|---|---|---|---|
| Previous Owner | Delano Bruce M | $25,000 | |
| Previous Owner | Delano Bruce M | $10,000 | |
| Previous Owner | Delano Bruce M | $5,000 |
Source: Public Records
Tax History Compared to Growth
Tax History
| Year | Tax Paid | Tax Assessment Tax Assessment Total Assessment is a certain percentage of the fair market value that is determined by local assessors to be the total taxable value of land and additions on the property. | Land | Improvement |
|---|---|---|---|---|
| 2025 | $28 | $297,900 | $170,500 | $127,400 |
| 2024 | $2,695 | $292,000 | $170,500 | $121,500 |
| 2023 | $2,607 | $262,000 | $149,300 | $112,700 |
| 2022 | $2,520 | $246,600 | $138,800 | $107,800 |
| 2021 | $17,747 | $212,800 | $125,500 | $87,300 |
| 2020 | $2,354 | $212,800 | $125,500 | $87,300 |
| 2019 | $2,157 | $184,800 | $104,100 | $80,700 |
| 2018 | $2,033 | $174,000 | $99,100 | $74,900 |
| 2017 | $2,005 | $166,500 | $99,100 | $67,400 |
| 2016 | $1,959 | $160,800 | $99,100 | $61,700 |
| 2015 | $1,931 | $158,900 | $99,100 | $59,800 |
Source: Public Records
Map
Nearby Homes