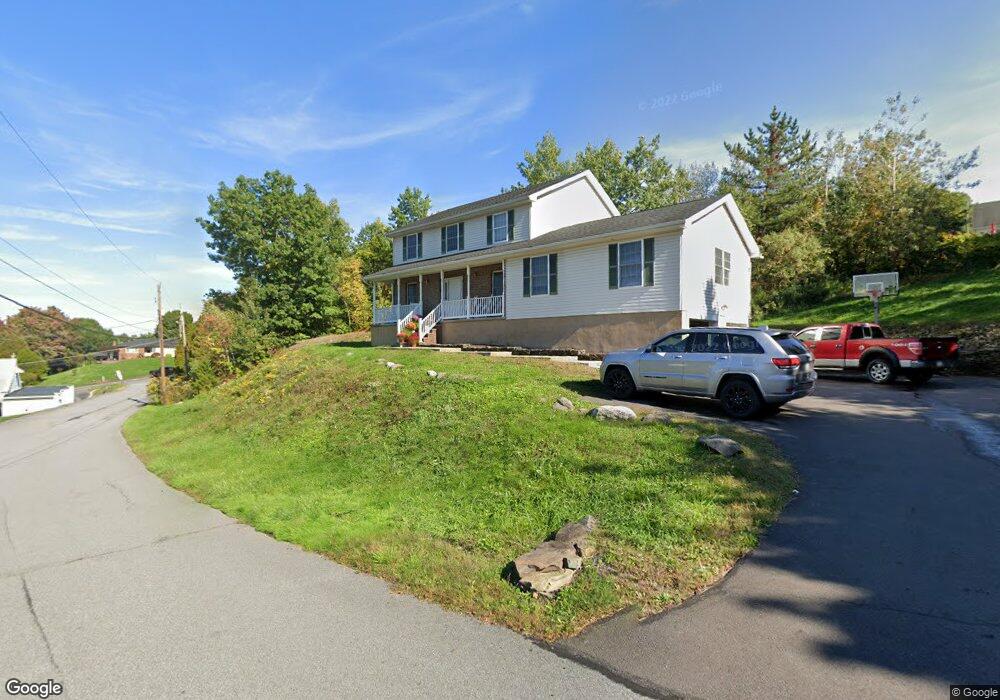
3 Atwell Dr Dupont, PA 18641
Estimated Value: $282,000 - $339,211
--
Bed
--
Bath
1,716
Sq Ft
$180/Sq Ft
Est. Value
About This Home
This home is located at 3 Atwell Dr, Dupont, PA 18641 and is currently estimated at $309,553, approximately $180 per square foot. 3 Atwell Dr is a home located in Luzerne County with nearby schools including Pittston City Intermediate Center, Pittston Area Middle School, and Frederick County Middle School.
Ownership History
Date
Name
Owned For
Owner Type
Purchase Details
Closed on
Dec 19, 2022
Sold by
Lepore Richard A and Lepore Erica F
Bought by
Lopatofsky Kristen Marie and Franklin Brenden Patrick
Current Estimated Value
Home Financials for this Owner
Home Financials are based on the most recent Mortgage that was taken out on this home.
Original Mortgage
$246,400
Outstanding Balance
$239,181
Interest Rate
7.08%
Mortgage Type
New Conventional
Estimated Equity
$70,372
Create a Home Valuation Report for This Property
The Home Valuation Report is an in-depth analysis detailing your home's value as well as a comparison with similar homes in the area
Home Values in the Area
Average Home Value in this Area
Purchase History
| Date | Buyer | Sale Price | Title Company |
|---|---|---|---|
| Lopatofsky Kristen Marie | $286,000 | -- |
Source: Public Records
Mortgage History
| Date | Status | Borrower | Loan Amount |
|---|---|---|---|
| Open | Lopatofsky Kristen Marie | $246,400 |
Source: Public Records
Tax History Compared to Growth
Tax History
| Year | Tax Paid | Tax Assessment Tax Assessment Total Assessment is a certain percentage of the fair market value that is determined by local assessors to be the total taxable value of land and additions on the property. | Land | Improvement |
|---|---|---|---|---|
| 2025 | $3,811 | $154,800 | $28,600 | $126,200 |
| 2024 | $3,811 | $154,800 | $28,600 | $126,200 |
| 2023 | $3,811 | $154,800 | $28,600 | $126,200 |
| 2022 | $3,783 | $154,800 | $28,600 | $126,200 |
| 2021 | $3,783 | $154,800 | $28,600 | $126,200 |
| 2020 | $3,696 | $154,800 | $28,600 | $126,200 |
| 2019 | $3,666 | $154,800 | $28,600 | $126,200 |
| 2018 | $3,589 | $154,800 | $28,600 | $126,200 |
| 2017 | $3,433 | $154,800 | $28,600 | $126,200 |
| 2016 | -- | $154,800 | $28,600 | $126,200 |
| 2015 | $2,923 | $154,800 | $28,600 | $126,200 |
| 2014 | $2,923 | $154,800 | $28,600 | $126,200 |
Source: Public Records
Map
Nearby Homes