Estimated Value: $114,000 - $143,794
2
Beds
1
Bath
994
Sq Ft
$130/Sq Ft
Est. Value
About This Home
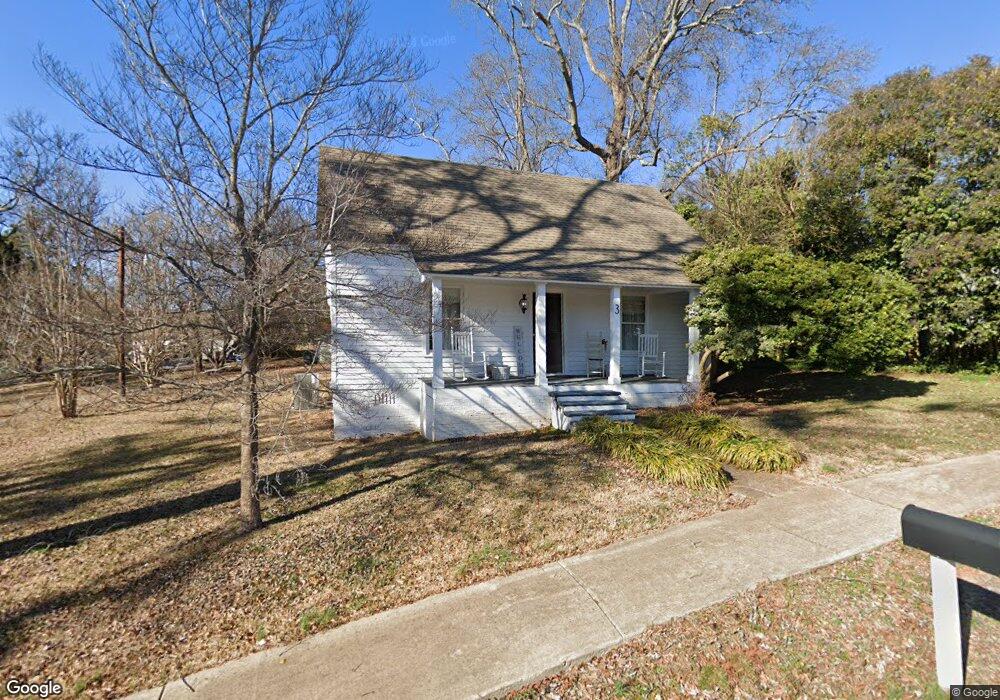
This home is located at 3 B St, Inman, SC 29349 and is currently estimated at $129,699, approximately $130 per square foot. 3 B St is a home located in Spartanburg County with nearby schools including Inman Elementary School, T.E. Mabry Middle School, and Chapman High School.
Ownership History
Date
Name
Owned For
Owner Type
Purchase Details
Closed on
May 24, 2018
Sold by
Lowe Curt Lynn
Bought by
Simon Fredrick Keith and Simon Angel Christina
Current Estimated Value
Home Financials for this Owner
Home Financials are based on the most recent Mortgage that was taken out on this home.
Original Mortgage
$61,750
Outstanding Balance
$53,169
Interest Rate
4.4%
Mortgage Type
New Conventional
Estimated Equity
$76,530
Purchase Details
Closed on
Sep 12, 2008
Sold by
Moore Cynthia
Bought by
Lowe Curt Lynn
Home Financials for this Owner
Home Financials are based on the most recent Mortgage that was taken out on this home.
Original Mortgage
$77,000
Interest Rate
5.75%
Mortgage Type
Purchase Money Mortgage
Purchase Details
Closed on
Jan 15, 2008
Sold by
Hud
Bought by
Moore Cynthia
Purchase Details
Closed on
Feb 26, 2007
Sold by
Howard James E and Truesdale Ashley E
Bought by
Hud
Purchase Details
Closed on
Aug 13, 2004
Sold by
Bridges Robert F
Bought by
Howard James E and Truesdale Ashley E
Create a Home Valuation Report for This Property
The Home Valuation Report is an in-depth analysis detailing your home's value as well as a comparison with similar homes in the area
Home Values in the Area
Average Home Value in this Area
Purchase History
| Date | Buyer | Sale Price | Title Company |
|---|---|---|---|
| Simon Fredrick Keith | $65,000 | None Available | |
| Lowe Curt Lynn | $77,000 | -- | |
| Moore Cynthia | $41,040 | None Available | |
| Hud | $2,500 | None Available | |
| Howard James E | $65,250 | -- |
Source: Public Records
Mortgage History
| Date | Status | Borrower | Loan Amount |
|---|---|---|---|
| Open | Simon Fredrick Keith | $61,750 | |
| Previous Owner | Lowe Curt Lynn | $77,000 |
Source: Public Records
Tax History Compared to Growth
Tax History
| Year | Tax Paid | Tax Assessment Tax Assessment Total Assessment is a certain percentage of the fair market value that is determined by local assessors to be the total taxable value of land and additions on the property. | Land | Improvement |
|---|---|---|---|---|
| 2025 | $706 | $3,666 | $611 | $3,055 |
| 2024 | $706 | $3,666 | $611 | $3,055 |
| 2023 | $706 | $3,666 | $611 | $3,055 |
| 2022 | $637 | $3,188 | $480 | $2,708 |
| 2021 | $637 | $3,188 | $480 | $2,708 |
| 2020 | $623 | $3,188 | $480 | $2,708 |
| 2019 | $623 | $3,188 | $480 | $2,708 |
| 2018 | $653 | $3,188 | $480 | $2,708 |
| 2017 | $1,940 | $4,452 | $720 | $3,732 |
| 2016 | $1,940 | $4,452 | $720 | $3,732 |
| 2015 | $606 | $2,968 | $480 | $2,488 |
| 2014 | $605 | $2,968 | $480 | $2,488 |
Source: Public Records
Map
Nearby Homes
- 10 A St
- 12 1st St
- 15 2nd St
- 28 Blackstock Rd
- 155 Wingo St
- 14 Littlefield St
- 9038 Legendary Ln
- 42 Bishop St
- 1091 Park Rd
- 7 Lawrence St
- 704 Adaline Dr
- Heatherwood Plan at Stones Throw
- Inman Plan at Stones Throw
- Reynolds Plan at Stones Throw
- Quincy Plan at Stones Throw
- Ellison Plan at Stones Throw
- Clifton Plan at Stones Throw
- Wellford Plan at Stones Throw
- Pacific Plan at Stones Throw
- Cheshire Plan at Stones Throw