3 Ba Dr Carver, MA 02330
Estimated Value: $551,306 - $660,000
4
Beds
1
Bath
1,280
Sq Ft
$485/Sq Ft
Est. Value
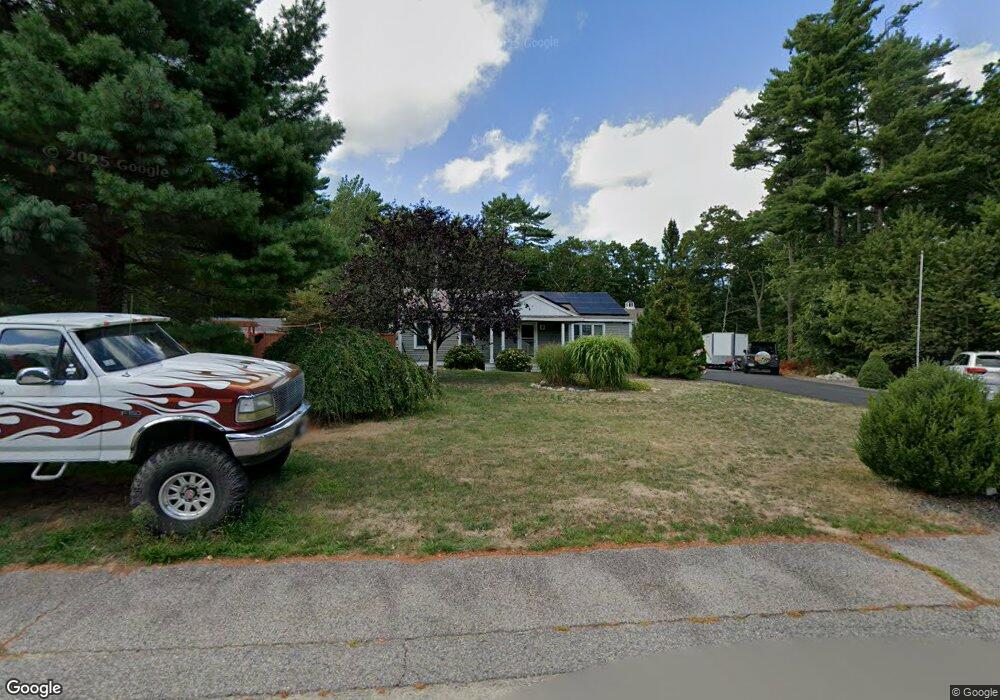
About This Home
This home is located at 3 Ba Dr, Carver, MA 02330 and is currently estimated at $620,827, approximately $485 per square foot. 3 Ba Dr is a home located in Plymouth County with nearby schools including Carver Elementary School, Carver Middle/High School, and Map Academy Charter School.
Ownership History
Date
Name
Owned For
Owner Type
Purchase Details
Closed on
Aug 24, 2007
Sold by
Langevin-Hardt Linda and Hardt David F
Bought by
Utley Jeremy M
Current Estimated Value
Home Financials for this Owner
Home Financials are based on the most recent Mortgage that was taken out on this home.
Original Mortgage
$294,500
Outstanding Balance
$187,603
Interest Rate
6.78%
Mortgage Type
Purchase Money Mortgage
Estimated Equity
$433,224
Purchase Details
Closed on
May 29, 2003
Sold by
Hardt Linda Langevin and Hardt Linda L
Bought by
Hardt Linda Langevin and Hardt Linda L
Create a Home Valuation Report for This Property
The Home Valuation Report is an in-depth analysis detailing your home's value as well as a comparison with similar homes in the area
Home Values in the Area
Average Home Value in this Area
Purchase History
| Date | Buyer | Sale Price | Title Company |
|---|---|---|---|
| Utley Jeremy M | $310,000 | -- | |
| Hardt Linda Langevin | -- | -- |
Source: Public Records
Mortgage History
| Date | Status | Borrower | Loan Amount |
|---|---|---|---|
| Open | Hardt Linda Langevin | $294,500 | |
| Previous Owner | Hardt Linda Langevin | $176,000 | |
| Previous Owner | Hardt Linda Langevin | $167,500 |
Source: Public Records
Tax History
| Year | Tax Paid | Tax Assessment Tax Assessment Total Assessment is a certain percentage of the fair market value that is determined by local assessors to be the total taxable value of land and additions on the property. | Land | Improvement |
|---|---|---|---|---|
| 2025 | $7,160 | $516,200 | $154,900 | $361,300 |
| 2024 | $6,870 | $484,800 | $151,900 | $332,900 |
| 2023 | $6,656 | $456,200 | $151,900 | $304,300 |
| 2022 | $6,301 | $394,300 | $129,900 | $264,400 |
| 2021 | $5,675 | $335,000 | $116,000 | $219,000 |
| 2020 | $5,195 | $302,200 | $108,400 | $193,800 |
| 2019 | $5,013 | $294,000 | $105,200 | $188,800 |
| 2018 | $4,758 | $269,900 | $105,200 | $164,700 |
| 2017 | $4,566 | $258,100 | $101,200 | $156,900 |
| 2016 | $4,028 | $236,500 | $96,400 | $140,100 |
| 2015 | $3,802 | $223,500 | $96,400 | $127,100 |
| 2014 | $3,885 | $228,400 | $121,900 | $106,500 |
Source: Public Records
Map
Nearby Homes