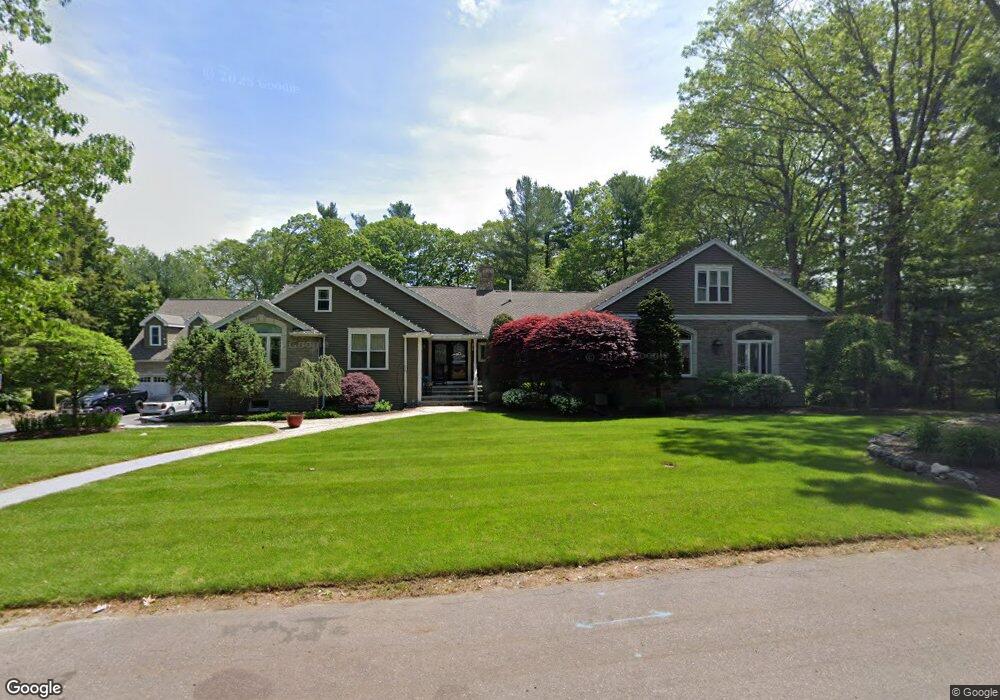
3 Baldwin Ln Lynnfield, MA 01940
Estimated Value: $1,404,000 - $1,805,250
5
Beds
4
Baths
3,500
Sq Ft
$469/Sq Ft
Est. Value
About This Home
This home is located at 3 Baldwin Ln, Lynnfield, MA 01940 and is currently estimated at $1,642,563, approximately $469 per square foot. 3 Baldwin Ln is a home located in Essex County with nearby schools including Lynnfield Middle School, Lynnfield High School, and Covenant Christian Academy.
Ownership History
Date
Name
Owned For
Owner Type
Purchase Details
Closed on
Dec 30, 2005
Sold by
Joshi Vivek V and Joshi Bhavini V
Bought by
Cataldo Dennis R and Cataldo Christine A
Current Estimated Value
Purchase Details
Closed on
Jun 14, 1996
Sold by
Peluso Theodore
Bought by
Joshi and Joshi Bhavini
Purchase Details
Closed on
May 12, 1987
Sold by
Meltzer Judith H
Bought by
Peluso Theodore
Create a Home Valuation Report for This Property
The Home Valuation Report is an in-depth analysis detailing your home's value as well as a comparison with similar homes in the area
Home Values in the Area
Average Home Value in this Area
Purchase History
| Date | Buyer | Sale Price | Title Company |
|---|---|---|---|
| Cataldo Dennis R | $808,000 | -- | |
| Joshi | $345,000 | -- | |
| Peluso Theodore | $355,000 | -- |
Source: Public Records
Mortgage History
| Date | Status | Borrower | Loan Amount |
|---|---|---|---|
| Open | Peluso Theodore | $417,000 | |
| Closed | Peluso Theodore | $417,000 |
Source: Public Records
Tax History
| Year | Tax Paid | Tax Assessment Tax Assessment Total Assessment is a certain percentage of the fair market value that is determined by local assessors to be the total taxable value of land and additions on the property. | Land | Improvement |
|---|---|---|---|---|
| 2025 | $15,837 | $1,499,700 | $766,400 | $733,300 |
| 2024 | $15,324 | $1,458,000 | $744,100 | $713,900 |
| 2023 | $14,768 | $1,306,900 | $659,100 | $647,800 |
| 2022 | $14,203 | $1,184,600 | $616,600 | $568,000 |
| 2021 | $13,137 | $990,000 | $510,400 | $479,600 |
| 2020 | $13,136 | $943,700 | $463,700 | $480,000 |
| 2019 | $12,742 | $916,000 | $436,000 | $480,000 |
| 2018 | $12,604 | $916,000 | $436,000 | $480,000 |
| 2017 | $12,622 | $916,000 | $436,000 | $480,000 |
| 2016 | $13,301 | $917,300 | $436,000 | $481,300 |
| 2015 | $12,658 | $873,600 | $392,300 | $481,300 |
Source: Public Records
Map
Nearby Homes
- 25 Apple Hill Ln
- 415 Lowell St
- 3 Willard Ln
- 9 Oxbow Rd
- 35 Lincoln Ave
- 15 Fairway Ln Unit 55
- 15 Fairway Ln
- 10 Fairway Ln
- 35 Homestead Rd
- 19 Fairway Ln Unit 53
- 1 Stableford Ct Unit 13
- 2 Bridle Path
- 4 Lowell St
- 5 Stableford Ct Unit 11
- 7 Stableford Ct Unit 10
- 9 Stableford Ct Unit 9
- 35 Catherine Dr
- 1466 Main St
- 11 Pontiac Rd
- 4 Green Meadow Dr
- 5 Baldwin Ln
- 32 Apple Hill Ln
- 4 Baldwin Ln
- 6 Baldwin Ln
- 6 Cider Mill Rd
- 2 Baldwin Ln
- 34 Apple Hill Ln
- 4 Cider Mill Rd
- 7 Baldwin Ln
- 17 Orchard Ln
- 35 Apple Hill Ln
- 19 Orchard Ln
- 8 Baldwin Ln
- 28 Apple Hill Ln
- 33 Apple Hill Ln
- 36 Apple Hill Ln
- 16 Orchard Ln
- 5 Cider Mill Rd
- 14 Orchard Ln
- 37 Apple Hill Ln
Your Personal Tour Guide
Ask me questions while you tour the home.