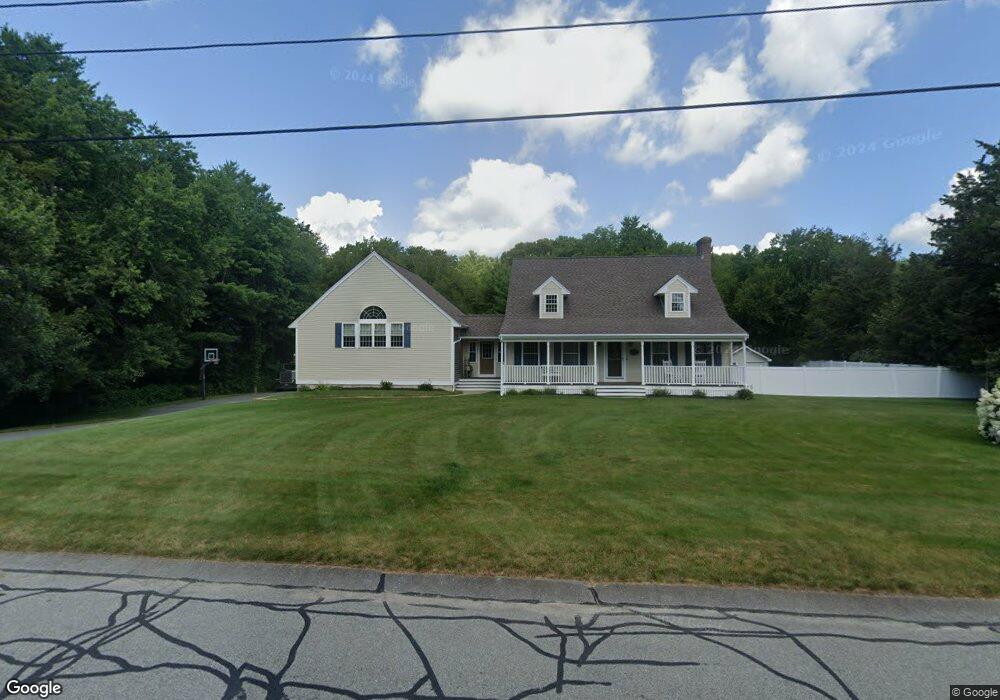
3 Balsam Brook Ln Acushnet, MA 02743
Upper Acushnet NeighborhoodEstimated Value: $508,000 - $635,000
2
Beds
2
Baths
2,235
Sq Ft
$263/Sq Ft
Est. Value
About This Home
This home is located at 3 Balsam Brook Ln, Acushnet, MA 02743 and is currently estimated at $588,521, approximately $263 per square foot. 3 Balsam Brook Ln is a home located in Bristol County with nearby schools including Acushnet Elementary School, Albert F Ford Middle School, and Alma Del Mar Charter School.
Ownership History
Date
Name
Owned For
Owner Type
Purchase Details
Closed on
Jan 29, 2003
Sold by
Jason Joseph P
Bought by
Jason James R and Jason Catherine
Current Estimated Value
Home Financials for this Owner
Home Financials are based on the most recent Mortgage that was taken out on this home.
Original Mortgage
$100,000
Interest Rate
6.09%
Mortgage Type
Purchase Money Mortgage
Create a Home Valuation Report for This Property
The Home Valuation Report is an in-depth analysis detailing your home's value as well as a comparison with similar homes in the area
Home Values in the Area
Average Home Value in this Area
Purchase History
| Date | Buyer | Sale Price | Title Company |
|---|---|---|---|
| Jason James R | $205,000 | -- |
Source: Public Records
Mortgage History
| Date | Status | Borrower | Loan Amount |
|---|---|---|---|
| Open | Jason James R | $150,000 | |
| Closed | Jason James R | $100,000 | |
| Previous Owner | Jason James R | $115,000 | |
| Previous Owner | Jason James R | $90,000 |
Source: Public Records
Tax History Compared to Growth
Tax History
| Year | Tax Paid | Tax Assessment Tax Assessment Total Assessment is a certain percentage of the fair market value that is determined by local assessors to be the total taxable value of land and additions on the property. | Land | Improvement |
|---|---|---|---|---|
| 2025 | $5,807 | $538,200 | $143,000 | $395,200 |
| 2024 | $5,755 | $504,400 | $135,200 | $369,200 |
| 2023 | $5,768 | $480,700 | $117,000 | $363,700 |
| 2022 | $5,764 | $434,400 | $111,800 | $322,600 |
| 2021 | $5,356 | $387,300 | $111,800 | $275,500 |
| 2020 | $5,399 | $387,300 | $111,800 | $275,500 |
| 2019 | $5,359 | $377,900 | $114,400 | $263,500 |
| 2018 | $5,055 | $361,000 | $114,400 | $246,600 |
| 2017 | $5,048 | $349,600 | $114,400 | $235,200 |
| 2016 | $5,049 | $347,500 | $106,600 | $240,900 |
| 2015 | $4,654 | $325,900 | $106,600 | $219,300 |
Source: Public Records
Map
Nearby Homes