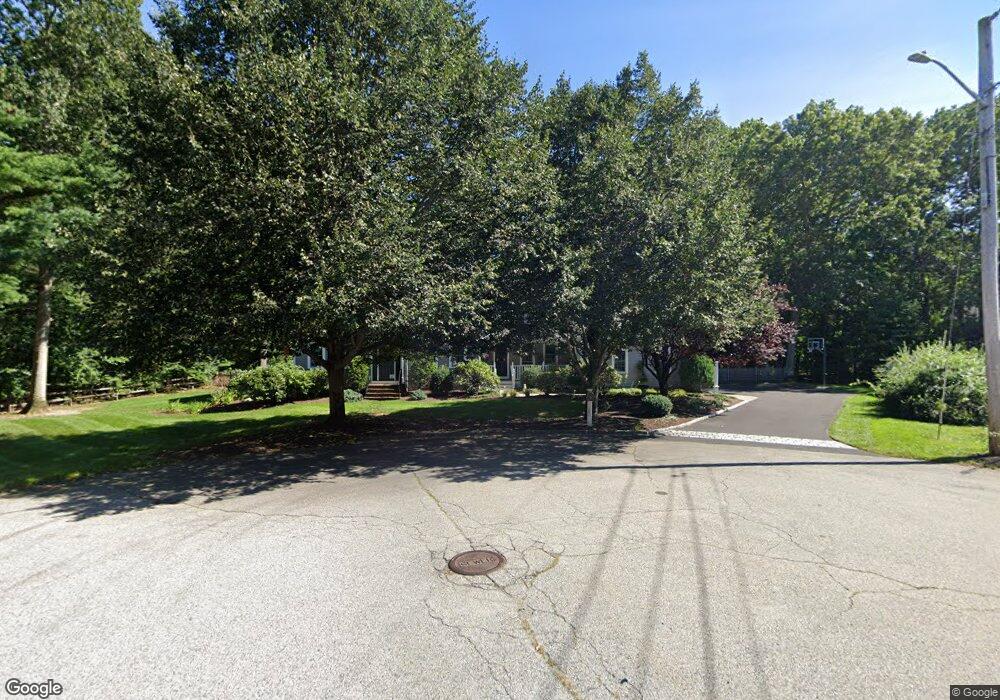
3 Beech Tree Ct Barrington, RI 02806
Hampden Meadows NeighborhoodEstimated Value: $1,011,000 - $1,312,000
4
Beds
3
Baths
3,393
Sq Ft
$349/Sq Ft
Est. Value
About This Home
This home is located at 3 Beech Tree Ct, Barrington, RI 02806 and is currently estimated at $1,182,855, approximately $348 per square foot. 3 Beech Tree Ct is a home located in Bristol County with nearby schools including Barrington High School, Barrington Christian Academy, and St. Andrews School.
Ownership History
Date
Name
Owned For
Owner Type
Purchase Details
Closed on
Oct 24, 2024
Sold by
Audette Robert P and Audette Debra A
Bought by
Debra A Audette Ret and Audette
Current Estimated Value
Purchase Details
Closed on
Jun 15, 1993
Sold by
Almeida Alfred and Almeida Kathleen
Bought by
Audette Robert P and Audette Debra
Create a Home Valuation Report for This Property
The Home Valuation Report is an in-depth analysis detailing your home's value as well as a comparison with similar homes in the area
Home Values in the Area
Average Home Value in this Area
Purchase History
| Date | Buyer | Sale Price | Title Company |
|---|---|---|---|
| Debra A Audette Ret | -- | None Available | |
| Debra A Audette Ret | -- | None Available | |
| Audette Robert P | $298,000 | -- | |
| Audette Robert P | $298,000 | -- |
Source: Public Records
Mortgage History
| Date | Status | Borrower | Loan Amount |
|---|---|---|---|
| Previous Owner | Audette Robert P | $100,000 | |
| Previous Owner | Audette Robert P | $345,000 |
Source: Public Records
Tax History Compared to Growth
Tax History
| Year | Tax Paid | Tax Assessment Tax Assessment Total Assessment is a certain percentage of the fair market value that is determined by local assessors to be the total taxable value of land and additions on the property. | Land | Improvement |
|---|---|---|---|---|
| 2025 | $16,352 | $1,066,000 | $431,000 | $635,000 |
| 2024 | $15,724 | $1,066,000 | $431,000 | $635,000 |
| 2023 | $14,981 | $738,000 | $279,000 | $459,000 |
| 2022 | $14,502 | $738,000 | $279,000 | $459,000 |
| 2021 | $14,133 | $738,000 | $279,000 | $459,000 |
| 2020 | $15,466 | $740,000 | $242,000 | $498,000 |
| 2019 | $14,874 | $740,000 | $242,000 | $498,000 |
| 2018 | $14,430 | $740,000 | $242,000 | $498,000 |
| 2017 | $13,994 | $699,700 | $235,200 | $464,500 |
| 2016 | $12,909 | $699,700 | $235,200 | $464,500 |
| 2015 | $12,656 | $693,500 | $235,200 | $458,300 |
| 2014 | $11,187 | $611,300 | $206,800 | $404,500 |
Source: Public Records
Map
Nearby Homes
- 7 Cheshire Dr
- 4 Old Chimney Rd
- 15 George w Finnerty Rd
- 20 Burr Ave
- 19 Evergreen St
- 7 Simmons Rd
- 6 Lafayette Rd
- 7 Wright Place
- 6 Plymouth Dr
- 43 Baptist St
- 55 Sowams Rd
- 1261 Grand Army of the Republic Hwy
- 0 Hampden St
- 3 Pine Top Rd
- 351 County Rd
- 10 Jesse Davis Ln
- 13 Kelly St
- 11 Mathewson Rd
- 112 County Rd
- 0 Old Fall River Rd Unit 73399047