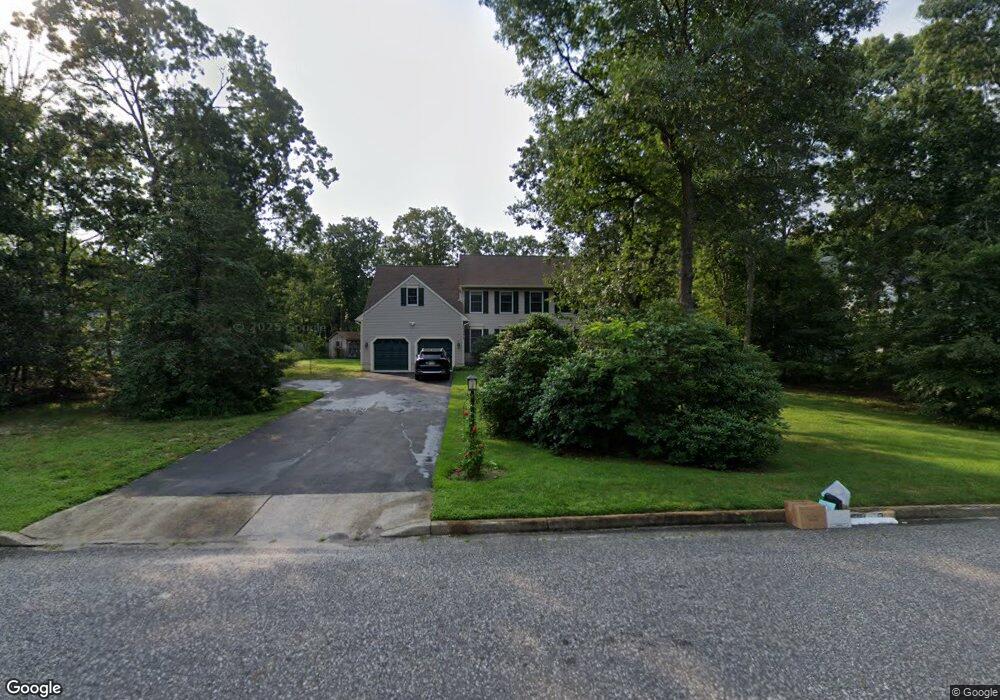
3 Berwyn Dr Ocean View, NJ 08230
Estimated Value: $917,396
Studio
--
Bath
3,085
Sq Ft
$297/Sq Ft
Est. Value
About This Home
This home is located at 3 Berwyn Dr, Ocean View, NJ 08230 and is currently estimated at $917,396, approximately $297 per square foot. 3 Berwyn Dr is a home located in Cape May County with nearby schools including Upper Township Primary School, Upper Township Elementary School, and Upper Township Middle School.
Ownership History
Date
Name
Owned For
Owner Type
Purchase Details
Closed on
Jul 16, 2004
Sold by
Obrien William F and Obrien Rose L
Bought by
Doughtie Harry and Doughtie Cathy L
Current Estimated Value
Home Financials for this Owner
Home Financials are based on the most recent Mortgage that was taken out on this home.
Original Mortgage
$120,000
Interest Rate
6.33%
Mortgage Type
Purchase Money Mortgage
Purchase Details
Closed on
Mar 31, 1989
Sold by
Aldon Homes Inc
Bought by
Obrien William and Obrien Rose
Create a Home Valuation Report for This Property
The Home Valuation Report is an in-depth analysis detailing your home's value as well as a comparison with similar homes in the area
Home Values in the Area
Average Home Value in this Area
Purchase History
| Date | Buyer | Sale Price | Title Company |
|---|---|---|---|
| Doughtie Harry | $410,000 | The Title Company Of Jersey | |
| Obrien William | $250,800 | -- |
Source: Public Records
Mortgage History
| Date | Status | Borrower | Loan Amount |
|---|---|---|---|
| Previous Owner | Doughtie Harry | $120,000 |
Source: Public Records
Tax History
| Year | Tax Paid | Tax Assessment Tax Assessment Total Assessment is a certain percentage of the fair market value that is determined by local assessors to be the total taxable value of land and additions on the property. | Land | Improvement |
|---|---|---|---|---|
| 2025 | -- | $353,900 | $137,900 | $216,000 |
| 2024 | -- | $353,900 | $137,900 | $216,000 |
| 2023 | $7,439 | $353,900 | $137,900 | $216,000 |
| 2022 | $7,439 | $353,900 | $137,900 | $216,000 |
| 2021 | $6,898 | $353,900 | $137,900 | $216,000 |
| 2020 | $6,898 | $353,900 | $137,900 | $216,000 |
| 2019 | $6,713 | $353,900 | $137,900 | $216,000 |
| 2018 | $6,537 | $353,900 | $137,900 | $216,000 |
| 2017 | $6,455 | $353,900 | $137,900 | $216,000 |
| 2016 | $6,268 | $337,900 | $137,900 | $200,000 |
| 2015 | $6,099 | $337,900 | $137,900 | $200,000 |
| 2014 | $7,092 | $481,800 | $218,600 | $263,200 |
Source: Public Records
Map
Nearby Homes
- 124 Butter Rd
- 297 Butter Rd
- 5 Klains Ln
- 40 Butter Rd
- 46 Victoria Ln
- 4 Bayview Ave
- 19 Bayview Ave
- 734 Stagecoach Rd
- 24 E Timber Dr
- 11 Evio John Ct
- 731 Oceancrest Ave
- 4 Sandcastle Dr
- 1729 Shore Rd
- 516 N Route 9 Unit B-16
- 516 N Route 9 Unit L-2
- 3 Sandcastle Dr
- 1731 Route 9 Unit 11
- 1731 Route 9 Unit 28
- 1731 Route 9 Unit 25
- 4 Prosit Ln
Your Personal Tour Guide
Ask me questions while you tour the home.