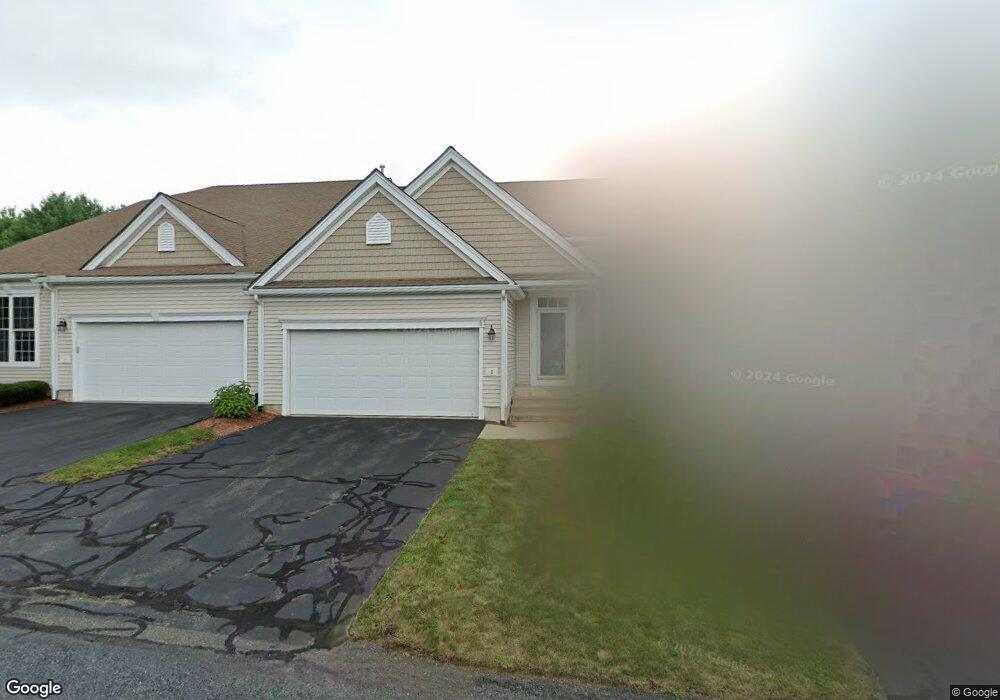
3 Bluebird Dr South Grafton, MA 01560
Estimated Value: $524,000 - $639,000
2
Beds
3
Baths
1,992
Sq Ft
$287/Sq Ft
Est. Value
About This Home
This home is located at 3 Bluebird Dr, South Grafton, MA 01560 and is currently estimated at $572,248, approximately $287 per square foot. 3 Bluebird Dr is a home located in Worcester County with nearby schools including Grafton High School, Touchstone Community School, and Silver Spruce Montessori School.
Ownership History
Date
Name
Owned For
Owner Type
Purchase Details
Closed on
May 17, 2013
Sold by
Gorke Daniel C and Gorke Deborah M
Bought by
Victor N Evdokimoff Re
Current Estimated Value
Purchase Details
Closed on
Jun 18, 2010
Sold by
Rosa Mark R
Bought by
Gorke Daniel C and Gorke Deborah M
Home Financials for this Owner
Home Financials are based on the most recent Mortgage that was taken out on this home.
Original Mortgage
$225,000
Interest Rate
5.03%
Mortgage Type
Purchase Money Mortgage
Purchase Details
Closed on
Dec 29, 2004
Sold by
Hilltop Farms Dev Llc
Bought by
Rosa Mark R
Home Financials for this Owner
Home Financials are based on the most recent Mortgage that was taken out on this home.
Original Mortgage
$237,672
Interest Rate
5.73%
Mortgage Type
Purchase Money Mortgage
Create a Home Valuation Report for This Property
The Home Valuation Report is an in-depth analysis detailing your home's value as well as a comparison with similar homes in the area
Home Values in the Area
Average Home Value in this Area
Purchase History
| Date | Buyer | Sale Price | Title Company |
|---|---|---|---|
| Victor N Evdokimoff Re | $299,000 | -- | |
| Gorke Daniel C | $300,000 | -- | |
| Rosa Mark R | $297,090 | -- |
Source: Public Records
Mortgage History
| Date | Status | Borrower | Loan Amount |
|---|---|---|---|
| Previous Owner | Gorke Daniel C | $225,000 | |
| Previous Owner | Rosa Mark R | $237,672 |
Source: Public Records
Tax History Compared to Growth
Tax History
| Year | Tax Paid | Tax Assessment Tax Assessment Total Assessment is a certain percentage of the fair market value that is determined by local assessors to be the total taxable value of land and additions on the property. | Land | Improvement |
|---|---|---|---|---|
| 2025 | $5,660 | $406,000 | $0 | $406,000 |
| 2024 | $6,472 | $452,300 | $0 | $452,300 |
| 2023 | $6,205 | $395,000 | $0 | $395,000 |
| 2022 | $5,673 | $336,100 | $0 | $336,100 |
| 2021 | $5,769 | $335,800 | $0 | $335,800 |
| 2020 | $5,224 | $316,600 | $0 | $316,600 |
| 2019 | $5,108 | $306,600 | $0 | $306,600 |
| 2018 | $5,164 | $311,300 | $0 | $311,300 |
| 2017 | $4,897 | $298,600 | $0 | $298,600 |
| 2016 | $4,995 | $298,200 | $0 | $298,200 |
| 2015 | $4,640 | $281,200 | $0 | $281,200 |
| 2014 | $4,291 | $281,200 | $0 | $281,200 |
Source: Public Records
Map
Nearby Homes
- 61 Tulip Cir
- 89 Buttercup Ln Unit 255
- 58 Buttercup Ln
- 79-81 Upton St
- 19 Milford Rd
- 2767 Providence Rd
- 395 Providence Rd Unit 4
- 86 Mikes Way Unit 86
- 84 Mikes Way Unit 84
- 27 Fowler St
- 42 Shining Rock Dr
- 3 Driscoll Ln
- 39 Mechanic St
- 135 Main St
- 151 Fowler Rd
- 18 Leland St
- 4 Jonathans Way
- 150 Sprague St
- 36 Knowlton Cir Unit 36
- 1 Jonathans Way
- 5 Bluebird Dr
- 1 Bluebird Dr
- 1 Bluebird Dr Unit 1
- 3 Bluebird Dr Unit 3
- 2 Buttercup Ln
- 2 Bluebird Dr
- 2 Bluebird Dr Unit 37
- 6 Bluebird Dr
- 4 Bluebird Dr
- 4 Bluebird Dr Unit 4
- 13 Buttercup Ln
- 13 Buttercup Ln Unit 13
- 7 Bluebird Dr
- 9 Buttercup Ln
- 9 Bluebird Dr
- 13 Bluebird Dr
- 11 Buttercup Ln
- 11 Buttercup Ln Unit 11
- 15 Buttercup Ln
- 15 Buttercup Ln Unit 15