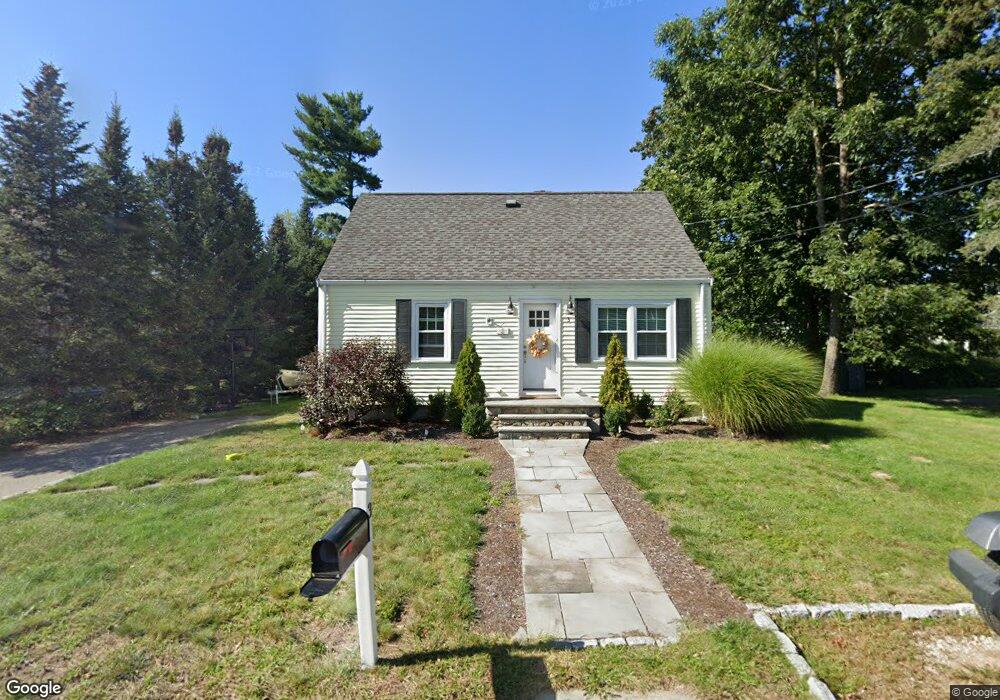
3 Boiling Spring Ave Medfield, MA 02052
Estimated Value: $624,000 - $755,000
3
Beds
1
Bath
1,008
Sq Ft
$661/Sq Ft
Est. Value
About This Home
This home is located at 3 Boiling Spring Ave, Medfield, MA 02052 and is currently estimated at $666,433, approximately $661 per square foot. 3 Boiling Spring Ave is a home located in Norfolk County with nearby schools including Ralph Wheelock School, Memorial School, and Dale Street School.
Ownership History
Date
Name
Owned For
Owner Type
Purchase Details
Closed on
Mar 27, 2009
Sold by
Ficcardi Francis N
Bought by
Riley Michael J and Riley Linda M
Current Estimated Value
Home Financials for this Owner
Home Financials are based on the most recent Mortgage that was taken out on this home.
Original Mortgage
$281,338
Outstanding Balance
$177,449
Interest Rate
5.14%
Mortgage Type
Purchase Money Mortgage
Estimated Equity
$488,984
Purchase Details
Closed on
Jan 26, 2007
Sold by
Ficcardi Francis N and Ficcardi Jennifer L
Bought by
Ficcardi Francis N
Purchase Details
Closed on
Apr 30, 1997
Sold by
Cerulle James V
Bought by
Ficcardi Francis N and Ficcardi Jennifer L
Home Financials for this Owner
Home Financials are based on the most recent Mortgage that was taken out on this home.
Original Mortgage
$159,300
Interest Rate
7.85%
Mortgage Type
Purchase Money Mortgage
Purchase Details
Closed on
Feb 15, 1994
Sold by
Joseph F Mccarthy T
Bought by
Cerulle James
Create a Home Valuation Report for This Property
The Home Valuation Report is an in-depth analysis detailing your home's value as well as a comparison with similar homes in the area
Home Values in the Area
Average Home Value in this Area
Purchase History
| Date | Buyer | Sale Price | Title Company |
|---|---|---|---|
| Riley Michael J | $287,000 | -- | |
| Riley Michael J | $287,000 | -- | |
| Ficcardi Francis N | -- | -- | |
| Ficcardi Francis N | -- | -- | |
| Ficcardi Francis N | $177,000 | -- | |
| Ficcardi Francis N | $177,000 | -- | |
| Cerulle James | $132,200 | -- | |
| Cerulle James V | $132,200 | -- |
Source: Public Records
Mortgage History
| Date | Status | Borrower | Loan Amount |
|---|---|---|---|
| Open | Riley Michael J | $281,338 | |
| Closed | Cerulle James V | $281,338 | |
| Previous Owner | Cerulle James V | $159,300 |
Source: Public Records
Tax History
| Year | Tax Paid | Tax Assessment Tax Assessment Total Assessment is a certain percentage of the fair market value that is determined by local assessors to be the total taxable value of land and additions on the property. | Land | Improvement |
|---|---|---|---|---|
| 2025 | $7,734 | $560,400 | $359,000 | $201,400 |
| 2024 | $7,604 | $519,400 | $330,000 | $189,400 |
| 2023 | $7,505 | $486,400 | $313,500 | $172,900 |
| 2022 | $7,067 | $405,700 | $282,200 | $123,500 |
| 2021 | $6,873 | $387,000 | $274,300 | $112,700 |
| 2020 | $6,783 | $380,400 | $271,200 | $109,200 |
| 2019 | $6,217 | $347,900 | $261,400 | $86,500 |
| 2018 | $5,700 | $334,700 | $254,200 | $80,500 |
| 2017 | $5,261 | $311,500 | $231,000 | $80,500 |
| 2016 | $5,191 | $309,900 | $229,400 | $80,500 |
| 2015 | $4,753 | $296,300 | $218,700 | $77,600 |
| 2014 | $4,465 | $277,000 | $199,400 | $77,600 |
Source: Public Records
Map
Nearby Homes
- 5 Boiling Spring Ave
- 5 Boiling Spring Ave
- 1 Boiling Spring Ave
- 101 Spring St
- 2 Robinson Rd
- 95 Spring St
- 105 Spring St
- 4 Boiling Spring Ave
- 7 Boiling Spring Ave
- 8 Robinson Rd
- 91 Spring St
- Lot 3 Robinson Rd
- 6 Boiling Spring Ave
- 38 Maple Ln Unit 38
- 40 Maple Ln Unit 40
- 40 Maple Ln Unit 40
- 36 Maple Ln Unit 36
- 3 Rhododendron Ave
- 1 Rhododendron Ave
- 3 Rhododendron Ave Unit 3
Your Personal Tour Guide
Ask me questions while you tour the home.