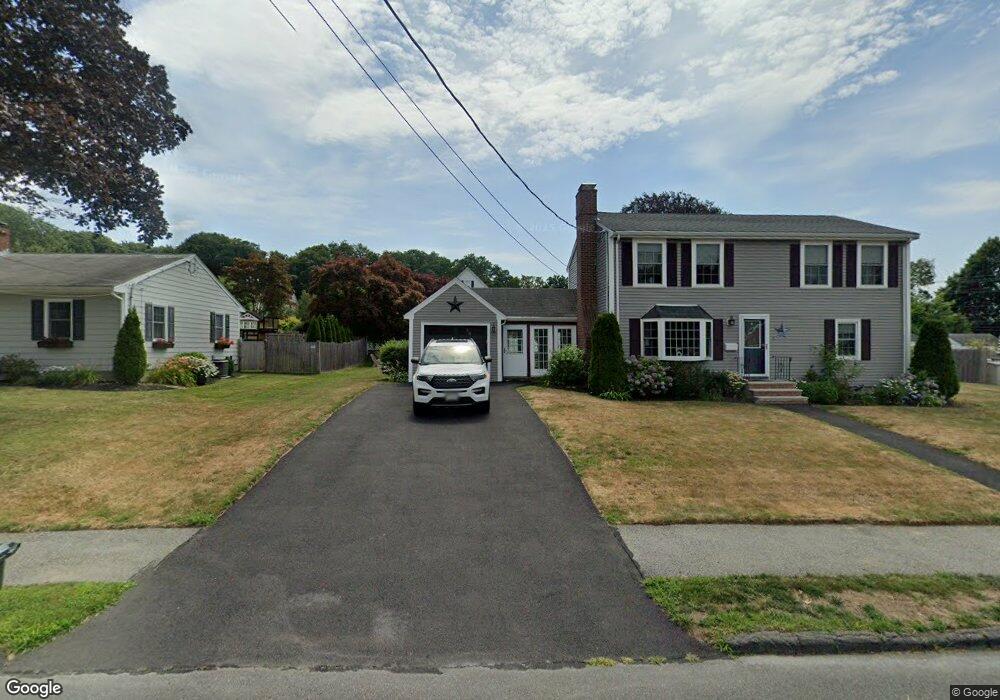
3 Bradley Rd Danvers, MA 01923
Estimated Value: $595,000 - $841,000
2
Beds
1
Bath
816
Sq Ft
$876/Sq Ft
Est. Value
About This Home
This home is located at 3 Bradley Rd, Danvers, MA 01923 and is currently estimated at $714,679, approximately $875 per square foot. 3 Bradley Rd is a home located in Essex County with nearby schools including Danvers High School, St. Mary of the Annunciation School, and North Shore Christian School.
Ownership History
Date
Name
Owned For
Owner Type
Purchase Details
Closed on
Aug 14, 2024
Sold by
Holt James
Bought by
James E Holt Ret and Holt
Current Estimated Value
Purchase Details
Closed on
Apr 10, 2023
Sold by
Holt Stacey
Bought by
Holt James
Home Financials for this Owner
Home Financials are based on the most recent Mortgage that was taken out on this home.
Original Mortgage
$356,000
Interest Rate
5.38%
Mortgage Type
Adjustable Rate Mortgage/ARM
Purchase Details
Closed on
Aug 16, 2010
Sold by
Mcdewell Rt and Deering
Bought by
Holt James and Holt Stacey
Home Financials for this Owner
Home Financials are based on the most recent Mortgage that was taken out on this home.
Original Mortgage
$212,000
Interest Rate
4.63%
Mortgage Type
Purchase Money Mortgage
Create a Home Valuation Report for This Property
The Home Valuation Report is an in-depth analysis detailing your home's value as well as a comparison with similar homes in the area
Home Values in the Area
Average Home Value in this Area
Purchase History
| Date | Buyer | Sale Price | Title Company |
|---|---|---|---|
| James E Holt Ret | -- | None Available | |
| James E Holt Ret | -- | None Available | |
| Holt James | -- | None Available | |
| Holt James | -- | None Available | |
| Holt James | -- | None Available | |
| Holt James | $265,000 | -- | |
| Holt James | $265,000 | -- |
Source: Public Records
Mortgage History
| Date | Status | Borrower | Loan Amount |
|---|---|---|---|
| Previous Owner | Holt James | $356,000 | |
| Previous Owner | Holt James | $213,000 | |
| Previous Owner | Holt James | $212,000 |
Source: Public Records
Tax History
| Year | Tax Paid | Tax Assessment Tax Assessment Total Assessment is a certain percentage of the fair market value that is determined by local assessors to be the total taxable value of land and additions on the property. | Land | Improvement |
|---|---|---|---|---|
| 2025 | $7,104 | $646,400 | $342,000 | $304,400 |
| 2024 | $7,033 | $633,000 | $342,000 | $291,000 |
| 2023 | $6,564 | $558,600 | $310,800 | $247,800 |
| 2022 | $6,586 | $520,200 | $282,000 | $238,200 |
| 2021 | $6,364 | $476,700 | $267,100 | $209,600 |
| 2020 | $6,479 | $496,100 | $264,000 | $232,100 |
| 2019 | $6,223 | $468,600 | $240,000 | $228,600 |
| 2018 | $6,073 | $448,500 | $237,600 | $210,900 |
| 2017 | $5,787 | $407,800 | $207,600 | $200,200 |
| 2016 | $5,578 | $392,800 | $198,000 | $194,800 |
| 2015 | $5,524 | $370,500 | $180,000 | $190,500 |
Source: Public Records
Map
Nearby Homes
- 508 Elliott St
- 59 Riverview Ave
- 147 High St
- 6 Mcdewell Ave Unit 4
- 34 Bayview Terrace Unit 5
- 13 Giles Ave Unit 2
- 11 Riverside Ave Unit 111
- 76 Water St
- 14 Chase St
- 14 Grove St
- 55 Burley St
- 35 High St Unit 3D
- 108 Abington Rd Unit 108
- 20 Central Ave
- 61 Ellsworth Ave
- 2 Chapel Rd
- 50 Balch St Unit 205
- 123 Livingstone Ave
- 5 Holten St
- 35 Locust St Unit 3
Your Personal Tour Guide
Ask me questions while you tour the home.