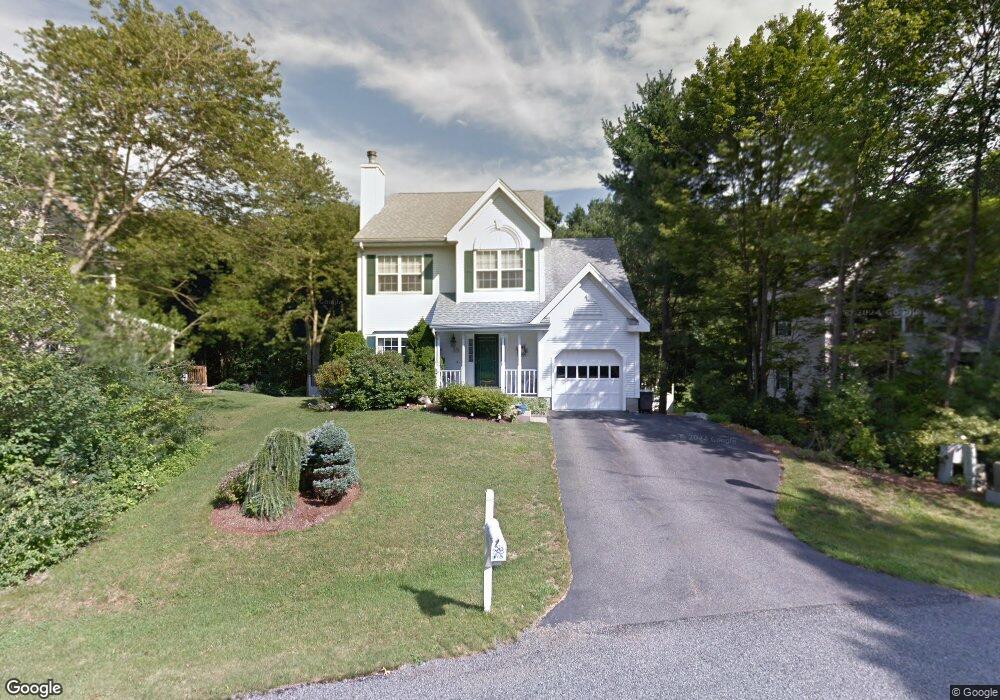
3 Bradshaw Ln Foxboro, MA 02035
Estimated Value: $716,000 - $763,468
2
Beds
3
Baths
1,828
Sq Ft
$404/Sq Ft
Est. Value
About This Home
This home is located at 3 Bradshaw Ln, Foxboro, MA 02035 and is currently estimated at $737,867, approximately $403 per square foot. 3 Bradshaw Ln is a home located in Norfolk County with nearby schools including Foxborough High School, Foxborough Regional Charter School, and The Sage School.
Ownership History
Date
Name
Owned For
Owner Type
Purchase Details
Closed on
Dec 4, 1995
Sold by
Kelfer John F and Keefer Laura A
Bought by
Lombardo Igino and Lombardo Ricki L
Current Estimated Value
Purchase Details
Closed on
Mar 11, 1993
Sold by
Summerfield Inc
Bought by
Keefer John F and Keefer Laura A
Create a Home Valuation Report for This Property
The Home Valuation Report is an in-depth analysis detailing your home's value as well as a comparison with similar homes in the area
Home Values in the Area
Average Home Value in this Area
Purchase History
| Date | Buyer | Sale Price | Title Company |
|---|---|---|---|
| Lombardo Igino | $209,900 | -- | |
| Keefer John F | $193,650 | -- |
Source: Public Records
Mortgage History
| Date | Status | Borrower | Loan Amount |
|---|---|---|---|
| Open | Keefer John F | $212,000 | |
| Closed | Keefer John F | $225,400 | |
| Closed | Keefer John F | $27,323 |
Source: Public Records
Tax History Compared to Growth
Tax History
| Year | Tax Paid | Tax Assessment Tax Assessment Total Assessment is a certain percentage of the fair market value that is determined by local assessors to be the total taxable value of land and additions on the property. | Land | Improvement |
|---|---|---|---|---|
| 2025 | $7,557 | $571,600 | $223,000 | $348,600 |
| 2024 | $7,422 | $549,400 | $227,000 | $322,400 |
| 2023 | $7,173 | $504,800 | $216,300 | $288,500 |
| 2022 | $6,504 | $447,900 | $181,300 | $266,600 |
| 2021 | $6,337 | $429,900 | $167,900 | $262,000 |
| 2020 | $6,137 | $421,200 | $167,900 | $253,300 |
| 2019 | $5,818 | $395,800 | $159,900 | $235,900 |
| 2018 | $5,671 | $389,200 | $159,900 | $229,300 |
| 2017 | $5,469 | $363,600 | $149,500 | $214,100 |
| 2016 | $5,371 | $362,400 | $150,600 | $211,800 |
| 2015 | $5,317 | $350,000 | $127,400 | $222,600 |
| 2014 | $5,058 | $337,400 | $119,100 | $218,300 |
Source: Public Records
Map
Nearby Homes
- 170 Cannon Forge Dr
- 132 Cannon Forge Dr
- 35 Independence Dr Unit 35
- 9 Independence Dr Unit 9
- 89 Oak St
- 12 Community Way
- Lot One Old Wolomolopoag St
- Lot Two Old Wolomolopoag St
- 5 Chase Dr
- 1 Revere Dr
- 52 Condor Rd
- 186 Mechanic St
- 14 Winter St Unit B
- 261 East St
- 18 Winter St Unit E
- 668 S Main St
- 1 Roseland St Unit A-1
- 11 W Belcher Rd Unit 2
- 84 Cocasset St Unit A6
- 630 S Main St