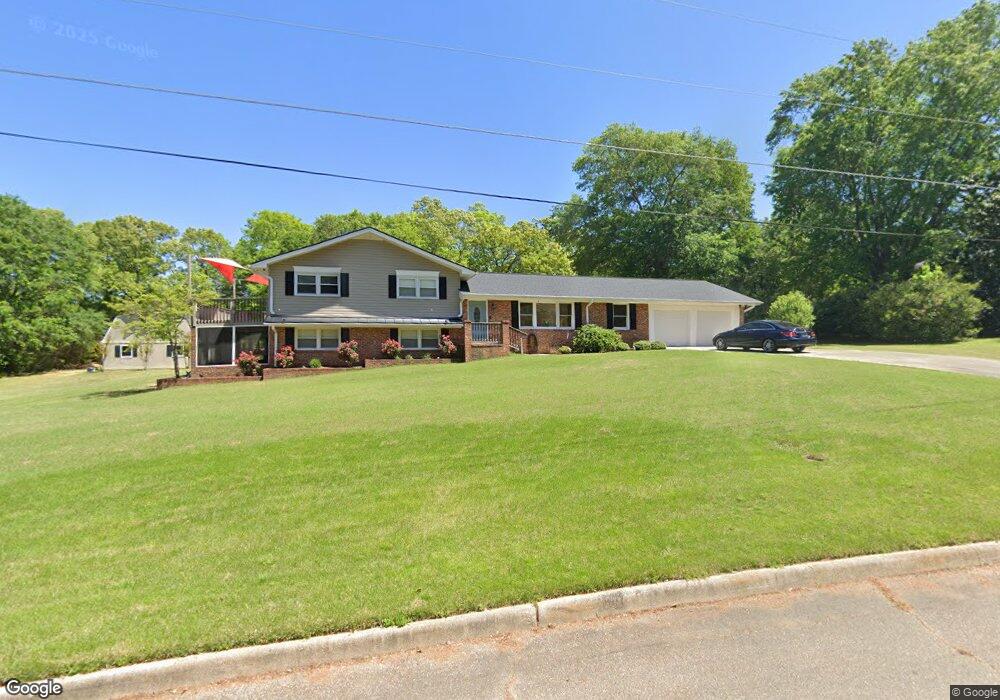
3 Briarwood Ct Simpsonville, SC 29681
Estimated Value: $375,000 - $507,000
4
Beds
3
Baths
2,350
Sq Ft
$194/Sq Ft
Est. Value
About This Home
This home is located at 3 Briarwood Ct, Simpsonville, SC 29681 and is currently estimated at $456,053, approximately $194 per square foot. 3 Briarwood Ct is a home located in Greenville County with nearby schools including Simpsonville Elementary, Hillcrest Middle School, and Hillcrest High School.
Ownership History
Date
Name
Owned For
Owner Type
Purchase Details
Closed on
Nov 12, 2024
Sold by
Crist Bradford
Bought by
Sublett Joyce Ann
Current Estimated Value
Purchase Details
Closed on
Oct 18, 2024
Sold by
Crist Bradford Thomas
Bought by
Sublett Joyce Ann
Purchase Details
Closed on
Sep 26, 2016
Sold by
Mark Iii Properties Inc
Bought by
D R Horton Crown Llc
Purchase Details
Closed on
Feb 20, 2014
Sold by
Barton J Daniel
Bought by
Global Real Estate Investments Llc
Home Financials for this Owner
Home Financials are based on the most recent Mortgage that was taken out on this home.
Original Mortgage
$99,840
Interest Rate
4.55%
Mortgage Type
New Conventional
Purchase Details
Closed on
Feb 3, 2011
Sold by
Barton Joe W
Bought by
Barton J Daniel
Create a Home Valuation Report for This Property
The Home Valuation Report is an in-depth analysis detailing your home's value as well as a comparison with similar homes in the area
Home Values in the Area
Average Home Value in this Area
Purchase History
| Date | Buyer | Sale Price | Title Company |
|---|---|---|---|
| Sublett Joyce Ann | -- | None Listed On Document | |
| Sublett Joyce Ann | -- | None Listed On Document | |
| Sublett Joyce Ann | -- | None Listed On Document | |
| D R Horton Crown Llc | $64,500 | None Available | |
| Global Real Estate Investments Llc | $67,500 | -- | |
| Barton J Daniel | -- | -- |
Source: Public Records
Mortgage History
| Date | Status | Borrower | Loan Amount |
|---|---|---|---|
| Previous Owner | Global Real Estate Investments Llc | $99,840 |
Source: Public Records
Tax History Compared to Growth
Tax History
| Year | Tax Paid | Tax Assessment Tax Assessment Total Assessment is a certain percentage of the fair market value that is determined by local assessors to be the total taxable value of land and additions on the property. | Land | Improvement |
|---|---|---|---|---|
| 2024 | $1,489 | $9,430 | $3,600 | $5,830 |
| 2023 | $1,489 | $7,400 | $2,960 | $4,440 |
| 2022 | $1,145 | $7,400 | $2,960 | $4,440 |
| 2021 | $1,145 | $7,400 | $2,960 | $4,440 |
| 2020 | $1,052 | $6,430 | $1,320 | $5,110 |
| 2019 | $1,053 | $6,430 | $1,320 | $5,110 |
| 2018 | $1,052 | $6,430 | $1,320 | $5,110 |
| 2017 | $1,053 | $6,430 | $1,320 | $5,110 |
| 2016 | $1,010 | $160,870 | $33,000 | $127,870 |
| 2015 | $1,012 | $160,870 | $33,000 | $127,870 |
| 2014 | $957 | $160,009 | $35,928 | $124,081 |
Source: Public Records
Map
Nearby Homes
- 416 Bridge Crossing Dr
- 221 Blue Danube Dr
- 415 Bridge Crossing Dr
- 114 Cross Arbor Dr
- Cary Plan at Riverbrooke Townhomes
- Ashland Plan at Riverbrooke Townhomes
- Bristol Plan at Riverbrooke Townhomes
- 508 Pennystone Ln
- 31 Allegheny Run
- 518 Pennystone Ln
- 520 Pennystone Ln
- 604 Autumn Lake Rd
- 619 Autumn Lake Rd
- 617 Autumn Lake Rd
- 615 Autumn Lake Rd
- 611 Autumn Lake Rd
- 6 Vintage Oaks Way
- 504 Rose Arbor Ln
- 5 Vintage Oaks Way
- 108 Foxhill Dr
- 7 Briarwood Ct
- 104 White Pine Dr
- 200 White Pine Dr
- 9 Briarwood Ct
- 10 Briarwood Ct
- 15 Briarwood Ct
- 124 Ponderosa Dr
- 130 Ponderosa Dr
- 122 Ponderosa Dr
- 105 White Pine Dr
- 211 White Pine Dr
- 120 Ponderosa Dr
- 192 Ponderosa Dr
- 101 White Pine Dr
- 205 Ponderosa Dr
- 111 White Pine Dr
- 204 Ponderosa Dr
- 115 Johnson Dr
- 206 Ponderosa Dr
- 124 Johnson Dr