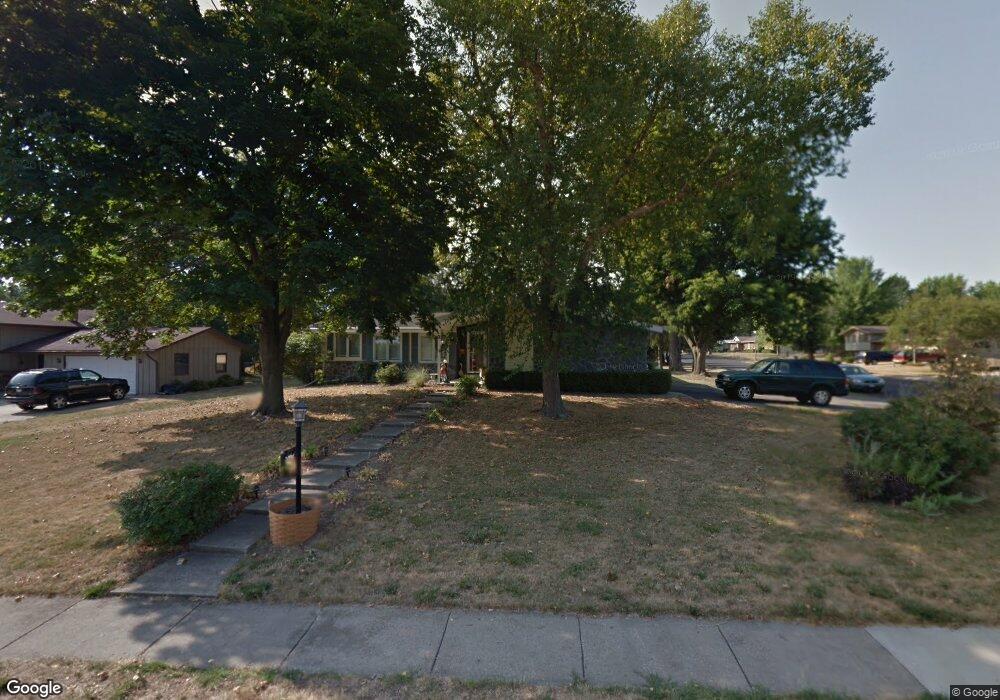
3 Briarwyck Dr Jacksonville, IL 62650
Estimated Value: $179,000 - $211,439
3
Beds
2
Baths
552
Sq Ft
$348/Sq Ft
Est. Value
About This Home
This home is located at 3 Briarwyck Dr, Jacksonville, IL 62650 and is currently estimated at $192,360, approximately $348 per square foot. 3 Briarwyck Dr is a home located in Morgan County with nearby schools including Jacksonville High School, Westfair Christian Academy, and Salem Lutheran School.
Ownership History
Date
Name
Owned For
Owner Type
Purchase Details
Closed on
Nov 25, 2024
Sold by
Hemenway Marilyn S and Lansaw Susan L
Bought by
Smith Sharon Rose
Current Estimated Value
Home Financials for this Owner
Home Financials are based on the most recent Mortgage that was taken out on this home.
Original Mortgage
$100,000
Outstanding Balance
$99,128
Interest Rate
6.25%
Mortgage Type
New Conventional
Estimated Equity
$93,232
Purchase Details
Closed on
Oct 6, 2015
Sold by
Hemenway Horace Eli and Hemenway Marilyn S
Bought by
Thornton Samuel W and Thornton Douglas E
Purchase Details
Closed on
Jul 3, 2003
Sold by
Yench Kathleen Ann
Bought by
Hemenway Horace Eli Marilyn
Create a Home Valuation Report for This Property
The Home Valuation Report is an in-depth analysis detailing your home's value as well as a comparison with similar homes in the area
Home Values in the Area
Average Home Value in this Area
Purchase History
| Date | Buyer | Sale Price | Title Company |
|---|---|---|---|
| Smith Sharon Rose | $140,000 | None Listed On Document | |
| Smith Sharon Rose | $140,000 | None Listed On Document | |
| Thornton Samuel W | -- | None Available | |
| Hemenway Horace Eli Marilyn | $112,500 | -- |
Source: Public Records
Mortgage History
| Date | Status | Borrower | Loan Amount |
|---|---|---|---|
| Open | Smith Sharon Rose | $100,000 | |
| Closed | Smith Sharon Rose | $100,000 |
Source: Public Records
Tax History Compared to Growth
Tax History
| Year | Tax Paid | Tax Assessment Tax Assessment Total Assessment is a certain percentage of the fair market value that is determined by local assessors to be the total taxable value of land and additions on the property. | Land | Improvement |
|---|---|---|---|---|
| 2024 | $3,088 | $64,300 | $8,500 | $55,800 |
| 2023 | $4,379 | $57,450 | $8,500 | $48,950 |
| 2022 | $3,754 | $50,400 | $8,500 | $41,900 |
| 2021 | $3,525 | $48,790 | $8,500 | $40,290 |
| 2020 | $3,532 | $47,860 | $8,500 | $39,360 |
| 2019 | $3,322 | $47,860 | $8,500 | $39,360 |
| 2018 | $3,600 | $50,510 | $10,760 | $39,750 |
| 2017 | $3,307 | $50,510 | $10,760 | $39,750 |
| 2016 | $3,341 | $48,110 | $10,250 | $37,860 |
| 2015 | $3,247 | $46,260 | $9,860 | $36,400 |
| 2014 | $3,247 | $45,800 | $9,760 | $36,040 |
| 2013 | $3,008 | $45,800 | $9,760 | $36,040 |
Source: Public Records
Map
Nearby Homes
- 1856 Plum St
- 1924 Cedar St
- 207 Mound Place
- 1845 Cedar St
- 3 Ivywood Dr
- 17 Merrygrove Dr
- 1903 Mound Rd
- 1835 Mound Rd
- 1815 Mound Rd
- 2 Valleyview Rd
- 8 Westfair Dr
- 33 Windrush Dr
- 414 S Westgate Ave
- 12 Newland Ln
- 13 Morningside Dr
- 400 Massey Ln
- 510 S Westgate Ave
- 108 Fairview Terrace
- 15A Shenandoah Ave
- 121 City Place