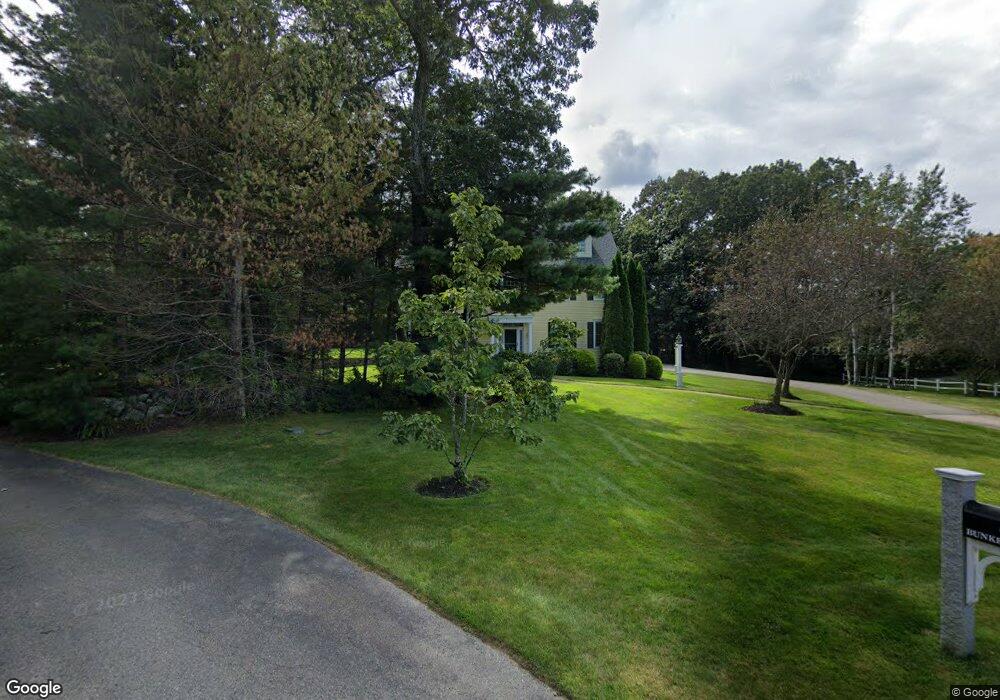
3 Bunker Rd Medfield, MA 02052
Estimated Value: $1,970,785 - $2,417,000
5
Beds
6
Baths
4,902
Sq Ft
$449/Sq Ft
Est. Value
About This Home
This home is located at 3 Bunker Rd, Medfield, MA 02052 and is currently estimated at $2,198,696, approximately $448 per square foot. 3 Bunker Rd is a home located in Norfolk County with nearby schools including Ralph Wheelock School, Memorial School, and Dale Street School.
Ownership History
Date
Name
Owned For
Owner Type
Purchase Details
Closed on
Jun 21, 2006
Sold by
Goodliffe Jennifer D and Goodliffe Robert B
Bought by
Stanton Mariah M and Stanton Peter M
Current Estimated Value
Home Financials for this Owner
Home Financials are based on the most recent Mortgage that was taken out on this home.
Original Mortgage
$1,000,000
Outstanding Balance
$588,576
Interest Rate
6.59%
Mortgage Type
Purchase Money Mortgage
Estimated Equity
$1,610,120
Create a Home Valuation Report for This Property
The Home Valuation Report is an in-depth analysis detailing your home's value as well as a comparison with similar homes in the area
Home Values in the Area
Average Home Value in this Area
Purchase History
| Date | Buyer | Sale Price | Title Company |
|---|---|---|---|
| Stanton Mariah M | $1,350,000 | -- | |
| Stanton Mariah M | $1,350,000 | -- |
Source: Public Records
Mortgage History
| Date | Status | Borrower | Loan Amount |
|---|---|---|---|
| Open | Stanton Mariah M | $523,700 | |
| Closed | Stanton Mariah M | $150,000 | |
| Open | Stanton Mariah M | $1,000,000 | |
| Closed | Stanton Mariah M | $80,000 | |
| Closed | Stanton Mariah M | $1,000,000 |
Source: Public Records
Tax History Compared to Growth
Tax History
| Year | Tax Paid | Tax Assessment Tax Assessment Total Assessment is a certain percentage of the fair market value that is determined by local assessors to be the total taxable value of land and additions on the property. | Land | Improvement |
|---|---|---|---|---|
| 2025 | $23,920 | $1,733,300 | $595,200 | $1,138,100 |
| 2024 | $23,668 | $1,616,700 | $520,000 | $1,096,700 |
| 2023 | $22,968 | $1,488,500 | $500,000 | $988,500 |
| 2022 | $22,494 | $1,291,300 | $480,000 | $811,300 |
| 2021 | $22,200 | $1,250,000 | $480,000 | $770,000 |
| 2020 | $21,852 | $1,225,600 | $478,000 | $747,600 |
| 2019 | $21,483 | $1,202,200 | $468,000 | $734,200 |
| 2018 | $20,186 | $1,185,300 | $468,000 | $717,300 |
| 2017 | $20,020 | $1,185,300 | $468,000 | $717,300 |
| 2016 | $19,959 | $1,191,600 | $468,000 | $723,600 |
| 2015 | $18,610 | $1,160,200 | $425,200 | $735,000 |
| 2014 | $18,296 | $1,135,000 | $400,000 | $735,000 |
Source: Public Records
Map
Nearby Homes
- 270 South St
- 11 Garry Dr
- 16 Lee Rd
- 9 Lakewood Dr
- 74 Granite St
- 12 Dutton Park
- 44 Millbrook Ave
- 94 Elm St
- 195 Lincoln Rd
- 13 Stop River Rd
- 12 Timberline Dr Unit 28
- 16 Stop River Rd
- 10 Stop River Rd
- 111 Elm St
- 21 Philip St
- The Georgetown L Plan at Lakeland Hills
- The Georgetown Grand L Plan at Lakeland Hills
- The Georgetown R Plan at Lakeland Hills
- The Georgetown Grand R Plan at Lakeland Hills
- 63 Thomas Mann Cir Unit 36