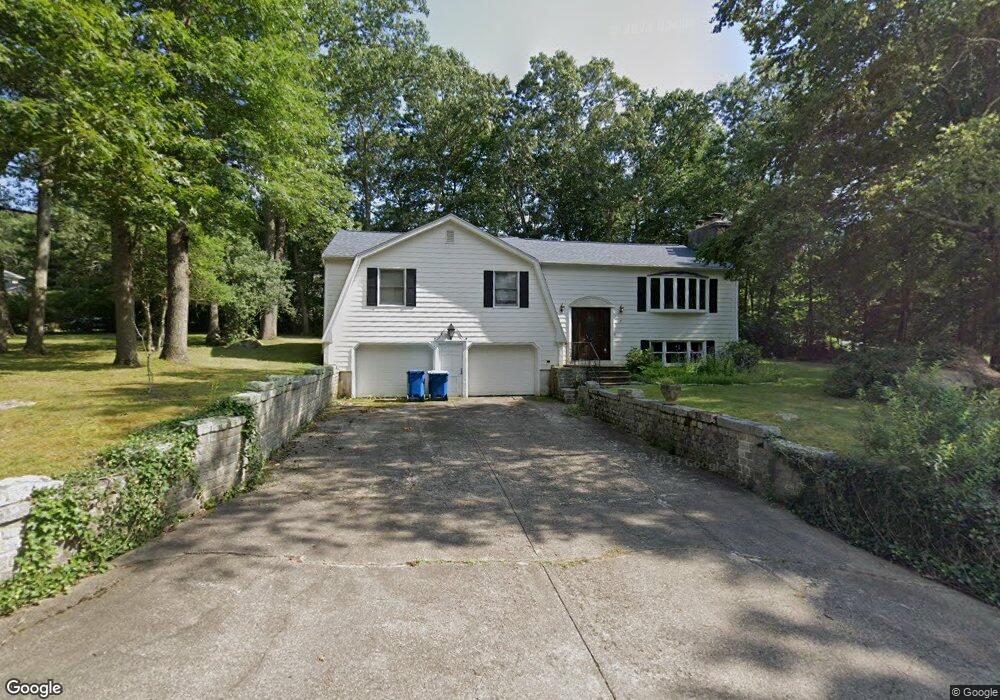
3 Buttercup Ln Westport, MA 02790
North Westport NeighborhoodEstimated Value: $496,690 - $705,000
3
Beds
2
Baths
1,506
Sq Ft
$387/Sq Ft
Est. Value
About This Home
This home is located at 3 Buttercup Ln, Westport, MA 02790 and is currently estimated at $582,673, approximately $386 per square foot. 3 Buttercup Ln is a home located in Bristol County with nearby schools including Alice A. Macomber Primary School, Westport Elementary School, and Westport Middle-High School.
Ownership History
Date
Name
Owned For
Owner Type
Purchase Details
Closed on
Mar 4, 2011
Sold by
Nowak Sheryl A
Bought by
Sheryl A Nowak Ret
Current Estimated Value
Purchase Details
Closed on
Aug 12, 1994
Sold by
Nowak Lucille T
Bought by
Nowak Sheryl
Home Financials for this Owner
Home Financials are based on the most recent Mortgage that was taken out on this home.
Original Mortgage
$127,500
Interest Rate
8.52%
Mortgage Type
Purchase Money Mortgage
Create a Home Valuation Report for This Property
The Home Valuation Report is an in-depth analysis detailing your home's value as well as a comparison with similar homes in the area
Home Values in the Area
Average Home Value in this Area
Purchase History
| Date | Buyer | Sale Price | Title Company |
|---|---|---|---|
| Sheryl A Nowak Ret | -- | -- | |
| Nowak Sheryl | $147,200 | -- |
Source: Public Records
Mortgage History
| Date | Status | Borrower | Loan Amount |
|---|---|---|---|
| Previous Owner | Nowak Sheryl | $127,500 |
Source: Public Records
Tax History Compared to Growth
Tax History
| Year | Tax Paid | Tax Assessment Tax Assessment Total Assessment is a certain percentage of the fair market value that is determined by local assessors to be the total taxable value of land and additions on the property. | Land | Improvement |
|---|---|---|---|---|
| 2025 | $2,959 | $397,200 | $157,000 | $240,200 |
| 2024 | $2,746 | $355,300 | $145,400 | $209,900 |
| 2023 | $2,582 | $316,400 | $132,200 | $184,200 |
| 2022 | $2,572 | $303,300 | $132,200 | $171,100 |
| 2021 | $2,449 | $284,100 | $120,200 | $163,900 |
| 2020 | $2,354 | $279,300 | $115,400 | $163,900 |
| 2019 | $2,206 | $266,800 | $115,400 | $151,400 |
| 2018 | $2,157 | $264,000 | $118,000 | $146,000 |
| 2017 | $2,037 | $255,600 | $118,000 | $137,600 |
| 2016 | $1,936 | $244,800 | $118,000 | $126,800 |
| 2015 | $2,198 | $277,200 | $118,000 | $159,200 |
Source: Public Records
Map
Nearby Homes
- 25 Christopher Cir
- 44 Tickle Rd
- 20 Christopher Cir
- 49 Tickle Rd
- 59 Tickle Rd
- 29 Christopher Cir
- 1 Holly Hill Ave
- 40 Tickle Rd
- 43 Tickle Rd
- 34 Christopher Cir
- 58 Tickle Rd
- 69 Tickle Rd
- 33 Christopher Cir
- 5 Holly Hill Ave
- 39 Tickle Rd
- 10 Christopher Cir
- 77 Tickle Rd
- 64 Tickle Rd
- 38 Christopher Cir
- 37 Christopher Cir