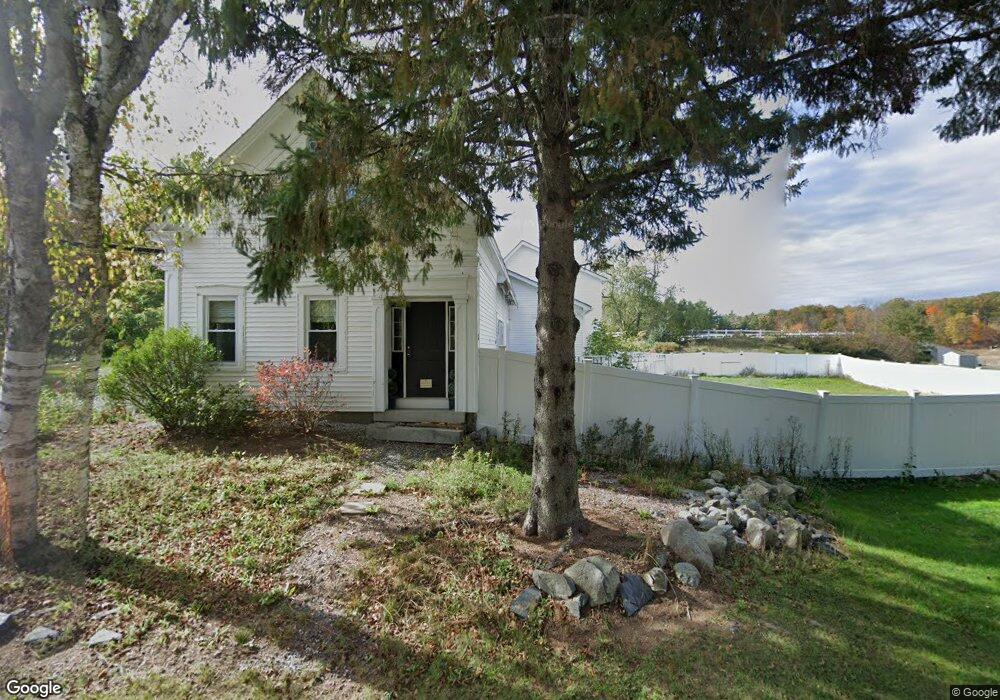
3 Buzzell Rd Biddeford, ME 04005
North Biddeford NeighborhoodEstimated Value: $665,278 - $813,000
4
Beds
2
Baths
3,083
Sq Ft
$232/Sq Ft
Est. Value
About This Home
This home is located at 3 Buzzell Rd, Biddeford, ME 04005 and is currently estimated at $713,820, approximately $231 per square foot. 3 Buzzell Rd is a home located in York County with nearby schools including John F Kennedy Memorial School, Biddeford Primary School, and Biddeford Intermediate School.
Ownership History
Date
Name
Owned For
Owner Type
Purchase Details
Closed on
May 23, 2017
Sold by
Gajewski Susan J and Gajewski Charles H
Bought by
Markell Jennifer A and Dutton Jeffrey C
Current Estimated Value
Home Financials for this Owner
Home Financials are based on the most recent Mortgage that was taken out on this home.
Original Mortgage
$294,566
Outstanding Balance
$242,610
Interest Rate
4.1%
Mortgage Type
FHA
Estimated Equity
$471,210
Create a Home Valuation Report for This Property
The Home Valuation Report is an in-depth analysis detailing your home's value as well as a comparison with similar homes in the area
Home Values in the Area
Average Home Value in this Area
Purchase History
| Date | Buyer | Sale Price | Title Company |
|---|---|---|---|
| Markell Jennifer A | -- | -- |
Source: Public Records
Mortgage History
| Date | Status | Borrower | Loan Amount |
|---|---|---|---|
| Open | Markell Jennifer A | $294,566 |
Source: Public Records
Tax History
| Year | Tax Paid | Tax Assessment Tax Assessment Total Assessment is a certain percentage of the fair market value that is determined by local assessors to be the total taxable value of land and additions on the property. | Land | Improvement |
|---|---|---|---|---|
| 2025 | $7,522 | $503,500 | $170,900 | $332,600 |
| 2024 | $7,079 | $497,800 | $170,900 | $326,900 |
| 2023 | $6,489 | $494,600 | $167,700 | $326,900 |
| 2022 | $6,485 | $395,200 | $78,400 | $316,800 |
| 2021 | $6,238 | $342,200 | $66,500 | $275,700 |
| 2020 | $6,314 | $314,900 | $56,100 | $258,800 |
| 2019 | $6,292 | $314,900 | $56,100 | $258,800 |
| 2018 | $6,204 | $314,900 | $56,100 | $258,800 |
| 2017 | $6,294 | $313,600 | $56,100 | $257,500 |
| 2016 | $6,228 | $313,600 | $56,100 | $257,500 |
| 2015 | $5,911 | $313,600 | $56,100 | $257,500 |
| 2014 | $5,765 | $313,600 | $56,100 | $257,500 |
| 2013 | -- | $349,200 | $66,400 | $282,800 |
Source: Public Records
Map
Nearby Homes
Your Personal Tour Guide
Ask me questions while you tour the home.