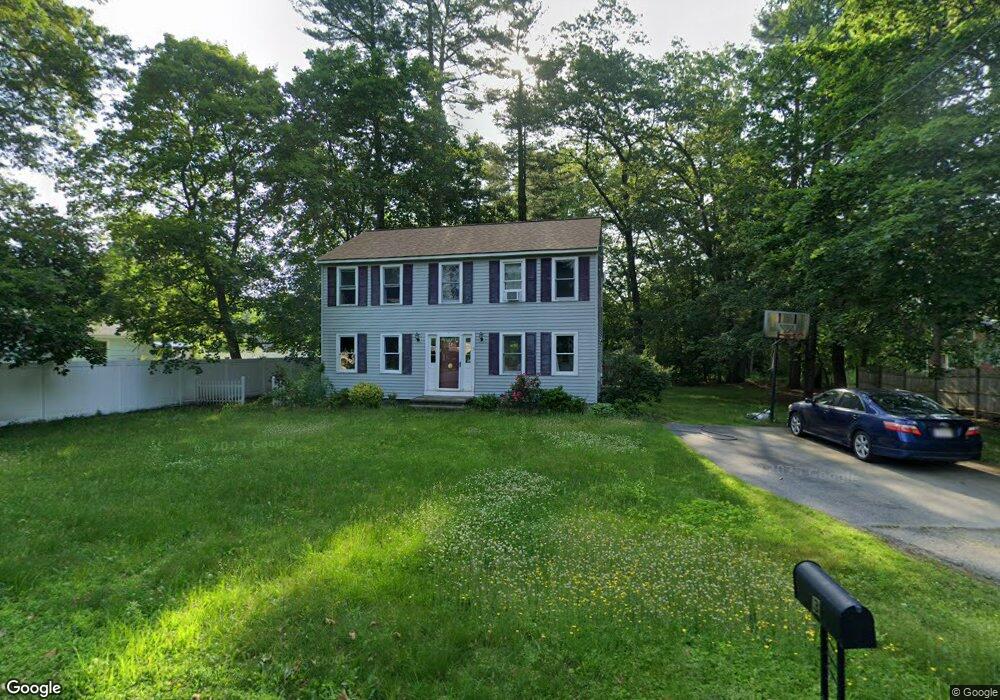
3 Byrne Place Westford, MA 01886
Estimated Value: $716,000 - $785,000
3
Beds
2
Baths
2,040
Sq Ft
$365/Sq Ft
Est. Value
About This Home
This home is located at 3 Byrne Place, Westford, MA 01886 and is currently estimated at $744,312, approximately $364 per square foot. 3 Byrne Place is a home located in Middlesex County with nearby schools including Nabnasset Elementary, Abbot Elementary School, and Stony Brook School.
Ownership History
Date
Name
Owned For
Owner Type
Purchase Details
Closed on
Aug 17, 2007
Sold by
Pandey Akhilesh Kumar
Bought by
Pandey Akhilesh Kumar and Pandey Shanti
Current Estimated Value
Purchase Details
Closed on
Dec 14, 2006
Sold by
Legrow Denise A and Legrow Gregory S
Bought by
Pandey Akhilesh Kumar
Purchase Details
Closed on
Apr 30, 2002
Sold by
Jones Brian A
Bought by
Legrow Gregory and Legrow Denise A
Purchase Details
Closed on
Oct 27, 2000
Sold by
Lacourse Brian C and Lacourse Michele I
Bought by
Jones Brian A
Purchase Details
Closed on
Oct 31, 1997
Sold by
Lizine Richard J and Lizine Wendy A
Bought by
Lacourse Brian C and Lang Michele I
Purchase Details
Closed on
Nov 1, 1993
Sold by
Est Golen Peter J and Chandler David
Bought by
Lizine Richard J and Lizine Wendy
Purchase Details
Closed on
Aug 25, 1992
Sold by
Est Golen Peter J
Bought by
Chandler David B
Create a Home Valuation Report for This Property
The Home Valuation Report is an in-depth analysis detailing your home's value as well as a comparison with similar homes in the area
Home Values in the Area
Average Home Value in this Area
Purchase History
| Date | Buyer | Sale Price | Title Company |
|---|---|---|---|
| Pandey Akhilesh Kumar | -- | -- | |
| Pandey Akhilesh Kumar | $410,000 | -- | |
| Legrow Gregory | $349,900 | -- | |
| Jones Brian A | $292,000 | -- | |
| Lacourse Brian C | $190,000 | -- | |
| Lizine Richard J | $153,000 | -- | |
| Chandler David B | $43,500 | -- | |
| Pandey Akhilesh Kumar | -- | -- | |
| Pandey Akhilesh Kumar | $410,000 | -- | |
| Gregory Legrow | $349,900 | -- | |
| Jones Brian A | $292,000 | -- | |
| Lacourse Brian C | $190,000 | -- | |
| Lizine Richard J | $153,000 | -- |
Source: Public Records
Mortgage History
| Date | Status | Borrower | Loan Amount |
|---|---|---|---|
| Open | Chandler David B | $294,400 |
Source: Public Records
Tax History Compared to Growth
Tax History
| Year | Tax Paid | Tax Assessment Tax Assessment Total Assessment is a certain percentage of the fair market value that is determined by local assessors to be the total taxable value of land and additions on the property. | Land | Improvement |
|---|---|---|---|---|
| 2025 | $8,077 | $586,600 | $271,100 | $315,500 |
| 2024 | $8,077 | $586,600 | $271,100 | $315,500 |
| 2023 | $7,982 | $540,800 | $258,300 | $282,500 |
| 2022 | $7,812 | $484,600 | $209,500 | $275,100 |
| 2021 | $7,370 | $442,900 | $209,500 | $233,400 |
| 2020 | $7,255 | $444,300 | $209,500 | $234,800 |
| 2019 | $7,046 | $425,500 | $209,500 | $216,000 |
| 2018 | $6,737 | $416,400 | $200,400 | $216,000 |
| 2017 | $6,456 | $393,400 | $200,400 | $193,000 |
| 2016 | $6,248 | $383,300 | $188,900 | $194,400 |
| 2015 | $6,109 | $376,200 | $180,700 | $195,500 |
| 2014 | $6,001 | $361,500 | $173,600 | $187,900 |
Source: Public Records
Map
Nearby Homes
- 2 Gassett Rd
- 74 Oak Hill Rd
- 11 Lake Shore Dr N
- 72 Oak Hill Rd
- 7 Lake Shore Dr N
- 76 Oak Hill Rd
- 15 Lake Shore Dr N
- 4 Gassett Rd
- 68 Oak Hill Rd
- 73 Oak Hill Rd
- 37 Byrne Ave
- 75 Oak Hill Rd
- 3 Gassett Rd
- 78 Oak Hill Rd
- 19 Lake Shore Dr N
- 8 Lake Shore Dr N
- 69 Oak Hill Rd
- 16 Lake Shore Dr N
- 6 Lake Shore Dr N
- 35 Byrne Ave