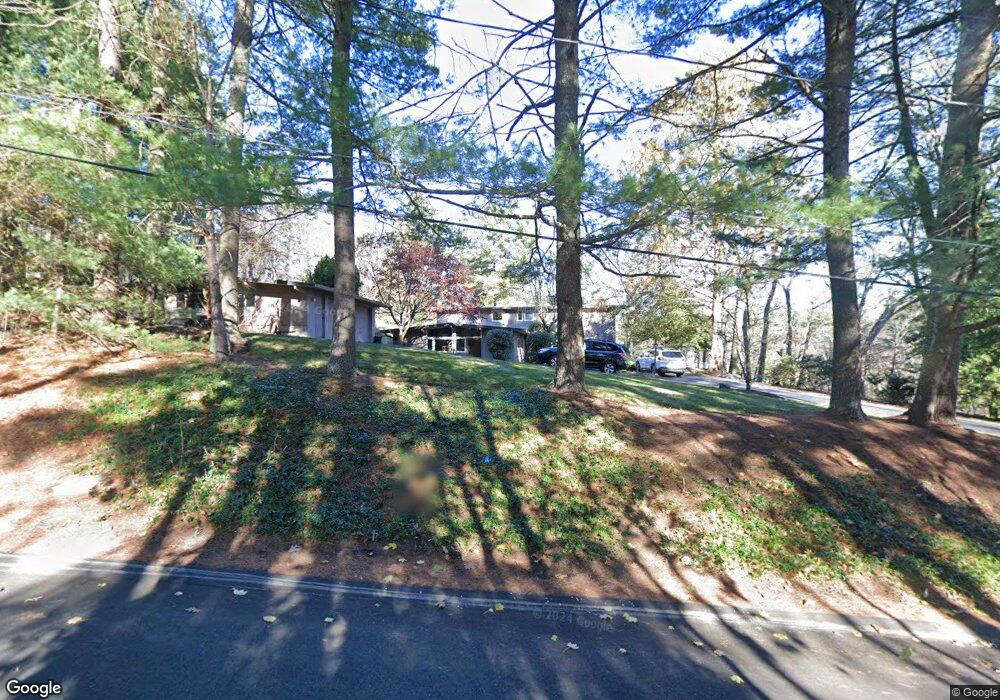
3 Cabot Rd Wayland, MA 01778
Estimated Value: $1,635,378 - $1,755,000
4
Beds
4
Baths
39
Sq Ft
$43,733/Sq Ft
Est. Value
About This Home
This home is located at 3 Cabot Rd, Wayland, MA 01778 and is currently estimated at $1,705,595, approximately $43,733 per square foot. 3 Cabot Rd is a home located in Middlesex County with nearby schools including Wayland High School, Veritas Christian Academy, and The Rivers School.
Ownership History
Date
Name
Owned For
Owner Type
Purchase Details
Closed on
Dec 31, 2009
Sold by
Ben Loren G
Bought by
Guzman Hector R and Ching Nina
Current Estimated Value
Home Financials for this Owner
Home Financials are based on the most recent Mortgage that was taken out on this home.
Original Mortgage
$572,000
Interest Rate
4.85%
Mortgage Type
Purchase Money Mortgage
Purchase Details
Closed on
Jan 25, 2007
Sold by
Ben Loren G and Beach Sally Anne
Bought by
Ben Loren G
Purchase Details
Closed on
Apr 25, 2006
Sold by
Ben Loren G and Beach Sally Anne
Bought by
Nigrosh Alvin L and Barraclough Bonnie L
Purchase Details
Closed on
Oct 15, 1999
Sold by
Houglet Michel X and Gilmore Maryann B
Bought by
Ben Loren G and Beach Sally A
Create a Home Valuation Report for This Property
The Home Valuation Report is an in-depth analysis detailing your home's value as well as a comparison with similar homes in the area
Home Values in the Area
Average Home Value in this Area
Purchase History
| Date | Buyer | Sale Price | Title Company |
|---|---|---|---|
| Guzman Hector R | $715,000 | -- | |
| Ben Loren G | -- | -- | |
| Nigrosh Alvin L | -- | -- | |
| Ben Loren G | $700,000 | -- |
Source: Public Records
Mortgage History
| Date | Status | Borrower | Loan Amount |
|---|---|---|---|
| Open | Ben Loren G | $523,750 | |
| Closed | Ben Loren G | $100,000 | |
| Closed | Guzman Hector R | $572,000 |
Source: Public Records
Tax History Compared to Growth
Tax History
| Year | Tax Paid | Tax Assessment Tax Assessment Total Assessment is a certain percentage of the fair market value that is determined by local assessors to be the total taxable value of land and additions on the property. | Land | Improvement |
|---|---|---|---|---|
| 2025 | $20,500 | $1,311,600 | $679,700 | $631,900 |
| 2024 | $19,405 | $1,250,300 | $647,100 | $603,200 |
| 2023 | $18,352 | $1,102,200 | $588,100 | $514,100 |
| 2022 | $18,020 | $982,000 | $487,100 | $494,900 |
| 2021 | $17,370 | $937,900 | $443,000 | $494,900 |
| 2020 | $16,488 | $928,400 | $443,000 | $485,400 |
| 2019 | $16,134 | $882,600 | $422,000 | $460,600 |
| 2018 | $14,987 | $831,200 | $422,000 | $409,200 |
| 2017 | $14,331 | $790,000 | $408,800 | $381,200 |
| 2016 | $13,962 | $805,200 | $417,900 | $387,300 |
| 2015 | $14,414 | $783,800 | $417,900 | $365,900 |
Source: Public Records
Map
Nearby Homes
- 5 Brook Trail Rd
- 125 Woodridge Rd
- 11 White Pine Knoll Rd
- 17 Smokey Hill Rd
- 12 Cutting Cross Way
- 260 Cochituate Rd
- 262 Cochituate Rd
- 106 Willow Brook Dr Unit 106
- 18 Coltsway Unit 18
- 208 Cochituate Rd
- 12 Nancy Rd
- 26 Dudley Rd
- 3 Keith Rd
- 6 Steepletree Ln
- 1601 Wisteria Way
- 1605 Wisteria Way
- 606 Wisteria Way
- 15 Crest Rd
- 62 E Plain St
- 35 Snake Brook Rd