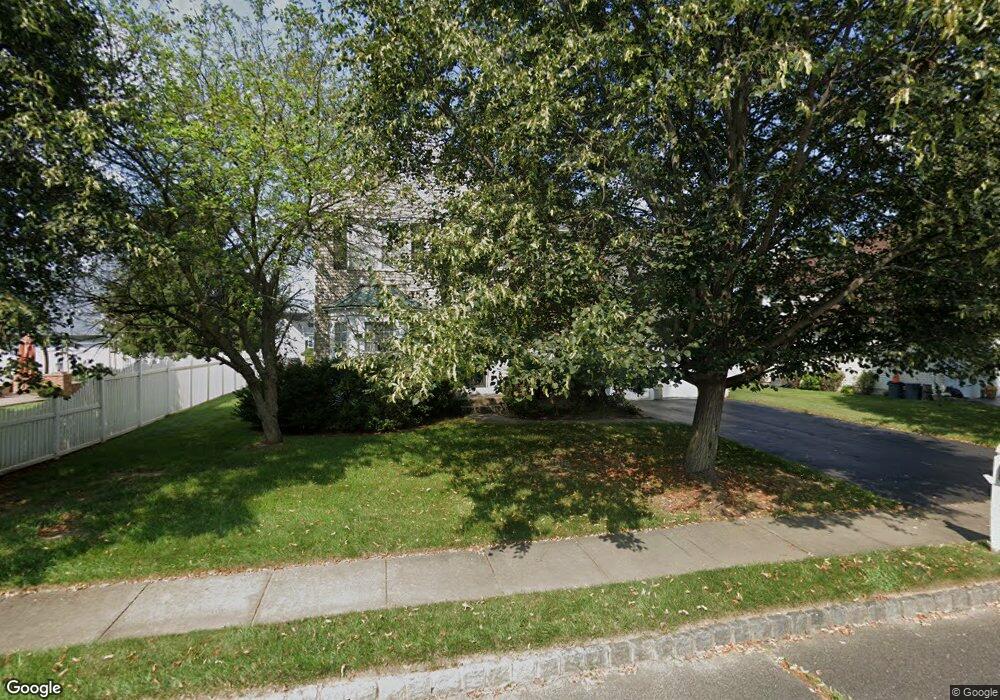
3 Cactus Way Dayton, NJ 08810
Estimated Value: $841,158 - $917,000
Studio
--
Bath
2,317
Sq Ft
$382/Sq Ft
Est. Value
About This Home
This home is located at 3 Cactus Way, Dayton, NJ 08810 and is currently estimated at $885,290, approximately $382 per square foot. 3 Cactus Way is a home located in Middlesex County with nearby schools including Indian Fields Elementary School, Crossroads South Middle School, and South Brunswick High School.
Ownership History
Date
Name
Owned For
Owner Type
Purchase Details
Closed on
Mar 13, 1996
Sold by
Sharbell Devel Corp
Bought by
Bi Leiqi and Than She Swe
Current Estimated Value
Home Financials for this Owner
Home Financials are based on the most recent Mortgage that was taken out on this home.
Original Mortgage
$185,000
Outstanding Balance
$7,215
Interest Rate
6.97%
Estimated Equity
$878,075
Purchase Details
Closed on
Mar 12, 1995
Sold by
Avonna Dev Corp
Bought by
Sharbell Devel Corp
Create a Home Valuation Report for This Property
The Home Valuation Report is an in-depth analysis detailing your home's value as well as a comparison with similar homes in the area
Home Values in the Area
Average Home Value in this Area
Purchase History
| Date | Buyer | Sale Price | Title Company |
|---|---|---|---|
| Bi Leiqi | $233,897 | -- | |
| Sharbell Devel Corp | $62,000 | -- |
Source: Public Records
Mortgage History
| Date | Status | Borrower | Loan Amount |
|---|---|---|---|
| Open | Bi Leiqi | $185,000 |
Source: Public Records
Tax History
| Year | Tax Paid | Tax Assessment Tax Assessment Total Assessment is a certain percentage of the fair market value that is determined by local assessors to be the total taxable value of land and additions on the property. | Land | Improvement |
|---|---|---|---|---|
| 2025 | $12,635 | $233,900 | $60,000 | $173,900 |
| 2024 | $12,182 | $233,900 | $60,000 | $173,900 |
Source: Public Records
Map
Nearby Homes
Your Personal Tour Guide
Ask me questions while you tour the home.