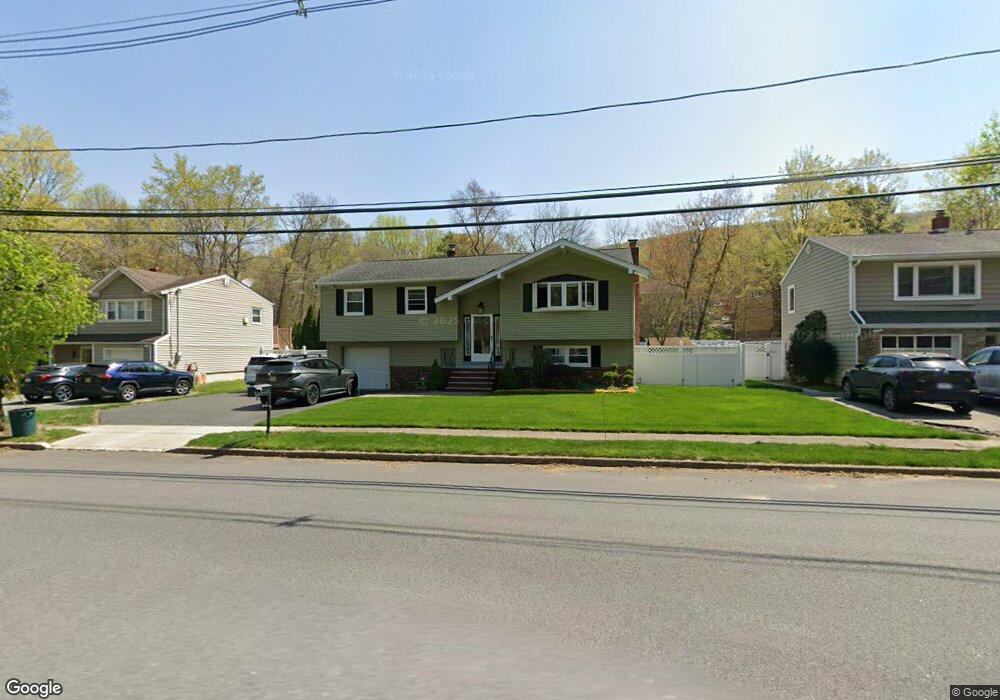
3 Cannonball Rd Wanaque, NJ 07465
Estimated Value: $528,909 - $614,000
Studio
--
Bath
2,026
Sq Ft
$280/Sq Ft
Est. Value
About This Home
This home is located at 3 Cannonball Rd, Wanaque, NJ 07465 and is currently estimated at $566,977, approximately $279 per square foot. 3 Cannonball Rd is a home located in Passaic County with nearby schools including Lakeland Reg High School.
Ownership History
Date
Name
Owned For
Owner Type
Purchase Details
Closed on
Jan 11, 2000
Sold by
Franz Paul R and Scheeler Gail
Bought by
Weisse Russell M and Weisse Wendy A
Current Estimated Value
Home Financials for this Owner
Home Financials are based on the most recent Mortgage that was taken out on this home.
Original Mortgage
$60,000
Outstanding Balance
$19,574
Interest Rate
7.98%
Mortgage Type
Credit Line Revolving
Estimated Equity
$547,403
Purchase Details
Closed on
Dec 21, 1998
Sold by
Franz Phyllis G
Bought by
Franz Paul R and Scheeler Gail
Create a Home Valuation Report for This Property
The Home Valuation Report is an in-depth analysis detailing your home's value as well as a comparison with similar homes in the area
Home Values in the Area
Average Home Value in this Area
Purchase History
| Date | Buyer | Sale Price | Title Company |
|---|---|---|---|
| Weisse Russell M | $200,000 | -- | |
| Franz Paul R | -- | -- |
Source: Public Records
Mortgage History
| Date | Status | Borrower | Loan Amount |
|---|---|---|---|
| Open | Weisse Russell M | $60,000 | |
| Open | Weisse Russell M | $120,000 |
Source: Public Records
Tax History
| Year | Tax Paid | Tax Assessment Tax Assessment Total Assessment is a certain percentage of the fair market value that is determined by local assessors to be the total taxable value of land and additions on the property. | Land | Improvement |
|---|---|---|---|---|
| 2025 | $11,913 | $276,200 | $107,100 | $169,100 |
| 2024 | $11,425 | $276,200 | $107,100 | $169,100 |
Source: Public Records
Map
Nearby Homes
- 3 Stephens Lake Rd
- 18 Schirra Dr
- 50 Roger Ct
- 16G Brookside Heights Unit G
- 16 Brookside Heights Unit 16G
- 7B Brookside Heights Unit B
- 18 Juniper Terrace
- 450 Skyline Lake Dr
- 49 Skyline Lake Dr
- 364 Skyline Lake Dr
- 32 Grove St
- 1116 Warrens Way
- 1118 Warrens Way
- 16 Wildwood Terrace
- 542 Ringwood Ave
- 3121 Warrens Way
- 3214 Warrens Way
- 3213 Warrens Way
- 25 Alta Vista Dr
- 5408 Warrens Way
Your Personal Tour Guide
Ask me questions while you tour the home.