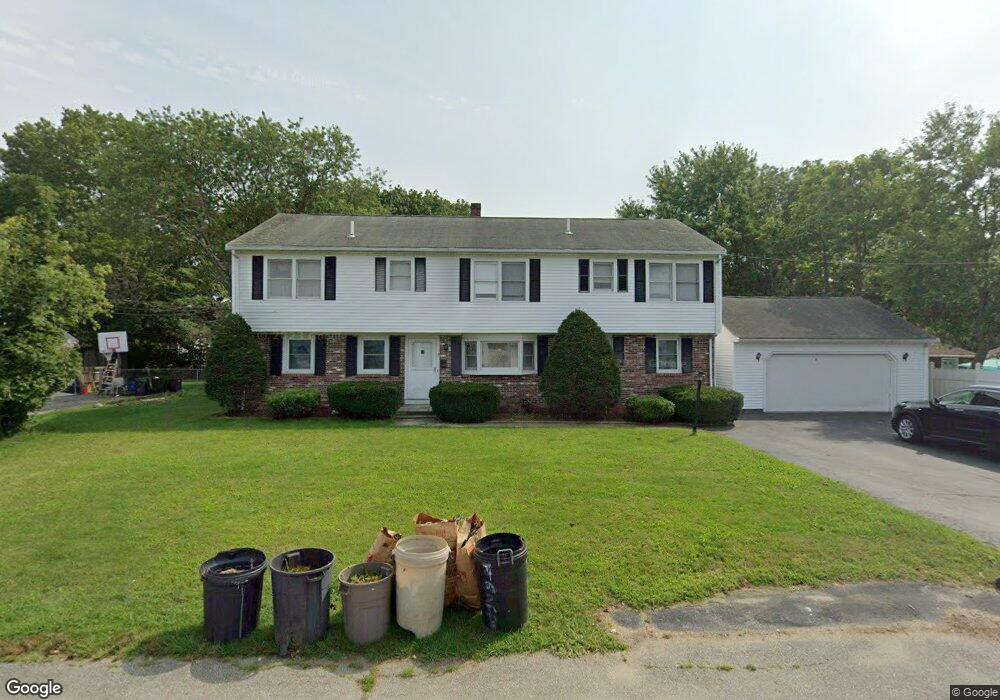
3 Carlena Terrace Woburn, MA 01801
Walnut Hill NeighborhoodEstimated Value: $932,486 - $1,360,000
7
Beds
5
Baths
2,938
Sq Ft
$396/Sq Ft
Est. Value
About This Home
This home is located at 3 Carlena Terrace, Woburn, MA 01801 and is currently estimated at $1,163,122, approximately $395 per square foot. 3 Carlena Terrace is a home located in Middlesex County with nearby schools including Goodyear Elementary School, John F. Kennedy Middle School, and Woburn High School.
Ownership History
Date
Name
Owned For
Owner Type
Purchase Details
Closed on
Oct 22, 2019
Sold by
Gaffney Hugh and Gaffney Brigid
Bought by
Brigid Gaffney Ret and Gaffney
Current Estimated Value
Purchase Details
Closed on
Jan 9, 2015
Sold by
Melanson Development G
Bought by
Zhou Xiaozhong and Wang Yili
Home Financials for this Owner
Home Financials are based on the most recent Mortgage that was taken out on this home.
Original Mortgage
$417,000
Interest Rate
3.99%
Mortgage Type
New Conventional
Purchase Details
Closed on
May 6, 2014
Sold by
859 Main Development L
Bought by
Collins William J and Collins Eileen E
Purchase Details
Closed on
Mar 26, 1968
Bought by
Gaffney Hugh
Create a Home Valuation Report for This Property
The Home Valuation Report is an in-depth analysis detailing your home's value as well as a comparison with similar homes in the area
Home Values in the Area
Average Home Value in this Area
Purchase History
| Date | Buyer | Sale Price | Title Company |
|---|---|---|---|
| Brigid Gaffney Ret | -- | -- | |
| Brigid Gaffney Ret | -- | -- | |
| Zhou Xiaozhong | $643,000 | -- | |
| Collins William J | $387,246 | -- | |
| Gaffney Hugh | -- | -- |
Source: Public Records
Mortgage History
| Date | Status | Borrower | Loan Amount |
|---|---|---|---|
| Previous Owner | Gaffney Hugh | $350,000 | |
| Previous Owner | Gaffney Hugh | $270,558 | |
| Previous Owner | Zhou Xiaozhong | $417,000 | |
| Previous Owner | Gaffney Hugh | $143,000 | |
| Previous Owner | Gaffney Hugh | $191,200 |
Source: Public Records
Tax History Compared to Growth
Tax History
| Year | Tax Paid | Tax Assessment Tax Assessment Total Assessment is a certain percentage of the fair market value that is determined by local assessors to be the total taxable value of land and additions on the property. | Land | Improvement |
|---|---|---|---|---|
| 2025 | $6,709 | $785,600 | $330,800 | $454,800 |
| 2024 | $6,028 | $747,900 | $315,000 | $432,900 |
| 2023 | $5,877 | $675,500 | $286,400 | $389,100 |
| 2022 | $5,738 | $614,300 | $249,100 | $365,200 |
| 2021 | $5,708 | $611,800 | $237,200 | $374,600 |
| 2020 | $5,486 | $588,600 | $237,200 | $351,400 |
| 2019 | $5,369 | $565,200 | $225,900 | $339,300 |
| 2018 | $5,224 | $528,200 | $207,300 | $320,900 |
| 2017 | $4,850 | $487,900 | $197,400 | $290,500 |
| 2016 | $4,641 | $461,800 | $184,400 | $277,400 |
| 2015 | $4,486 | $441,100 | $172,400 | $268,700 |
| 2014 | $4,411 | $422,500 | $172,400 | $250,100 |
Source: Public Records
Map
Nearby Homes
- 295 Salem St Unit 69
- 13 Elaine Rd
- 405 William St
- 18 Carmen Terrace
- 246 Walnut St
- 75 Border Rd
- 18 Central St
- 97 Oak St
- 13 Fremont St Unit 13
- 74 Beach St Unit 6-12
- 74 Beach St Unit 3
- 133 Pine Ridge Rd
- 200 Ledgewood Dr Unit 505
- 100 Ledgewood Dr Unit 417
- 100 Ledgewood Dr Unit 618
- 3 Frank St
- 6 Stratton Dr Unit 404
- 6 Stratton Dr Unit 410
- 20 Oak St
- 313 South St
- 5 Carlena Terrace
- 291 Washington St
- 289 Washington St
- 350 Salem St
- 4 Carlena Terrace
- 352 Salem St
- 6 Carlena Terrace
- 7 Carlena Terrace
- 293 Washington St
- 354 Salem St
- 8 Carlena Terrace
- 320 Salem St
- 9 Carlena Terrace
- 351 Salem St
- 295 Washington St
- 10 Carlena Terrace
- 356 Salem St
- 353 Salem St
- 11 Carlena Terrace
- 355 Salem St