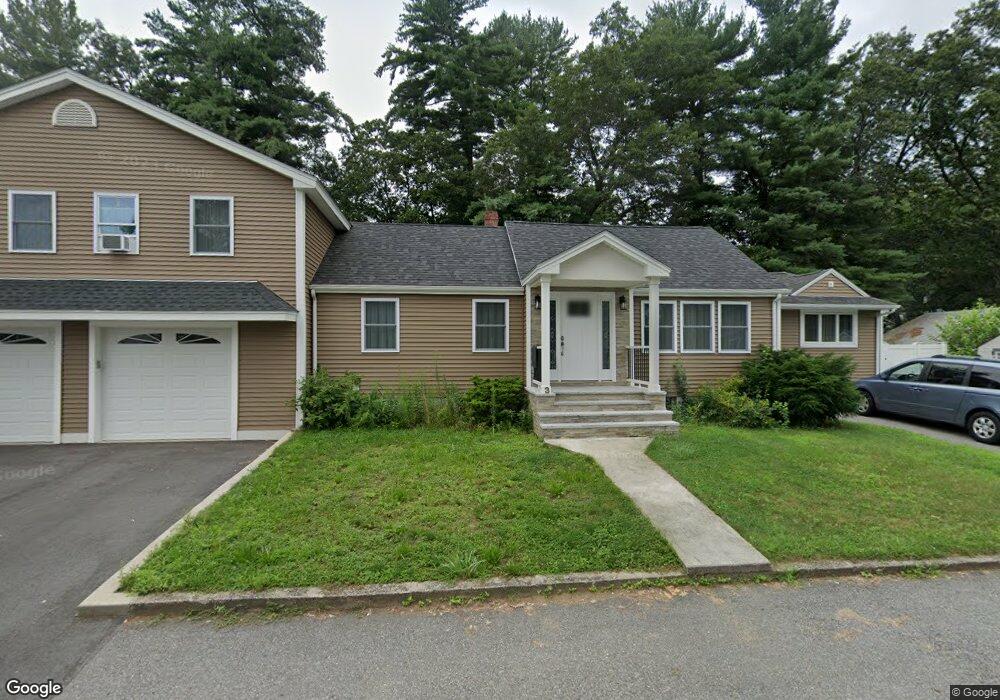
3 Carson St Billerica, MA 01821
Pinehurst NeighborhoodEstimated Value: $570,000 - $712,000
2
Beds
2
Baths
2,310
Sq Ft
$283/Sq Ft
Est. Value
About This Home
This home is located at 3 Carson St, Billerica, MA 01821 and is currently estimated at $654,501, approximately $283 per square foot. 3 Carson St is a home located in Middlesex County with nearby schools including Billerica Memorial High School, Mount Hope Christian School, and Burlington Montessori School.
Ownership History
Date
Name
Owned For
Owner Type
Purchase Details
Closed on
Jan 15, 2010
Sold by
Fiumaro Joseph and Fiumaro Rita
Bought by
Pantano Antonino
Current Estimated Value
Home Financials for this Owner
Home Financials are based on the most recent Mortgage that was taken out on this home.
Original Mortgage
$220,924
Outstanding Balance
$143,272
Interest Rate
4.71%
Mortgage Type
Purchase Money Mortgage
Estimated Equity
$511,229
Purchase Details
Closed on
Aug 19, 2005
Sold by
Eich Ft and Eich
Bought by
Jln Nt and Kelly
Create a Home Valuation Report for This Property
The Home Valuation Report is an in-depth analysis detailing your home's value as well as a comparison with similar homes in the area
Home Values in the Area
Average Home Value in this Area
Purchase History
| Date | Buyer | Sale Price | Title Company |
|---|---|---|---|
| Pantano Antonino | $225,000 | -- | |
| Fiumaro Joseph | -- | -- | |
| Jln Nt | $60,000 | -- |
Source: Public Records
Mortgage History
| Date | Status | Borrower | Loan Amount |
|---|---|---|---|
| Open | Pantano Antonino | $220,924 |
Source: Public Records
Tax History
| Year | Tax Paid | Tax Assessment Tax Assessment Total Assessment is a certain percentage of the fair market value that is determined by local assessors to be the total taxable value of land and additions on the property. | Land | Improvement |
|---|---|---|---|---|
| 2025 | $5,945 | $522,900 | $263,000 | $259,900 |
| 2024 | $5,714 | $506,100 | $254,600 | $251,500 |
| 2023 | $5,934 | $499,900 | $231,700 | $268,200 |
| 2022 | $5,280 | $417,700 | $198,000 | $219,700 |
| 2021 | $4,412 | $339,400 | $173,900 | $165,500 |
| 2020 | $4,191 | $322,600 | $167,100 | $155,500 |
| 2019 | $4,181 | $310,200 | $167,100 | $143,100 |
| 2018 | $3,736 | $263,300 | $148,500 | $114,800 |
| 2017 | $3,535 | $250,900 | $147,000 | $103,900 |
| 2016 | $3,500 | $247,500 | $143,600 | $103,900 |
| 2015 | $3,413 | $243,100 | $139,200 | $103,900 |
| 2014 | $3,412 | $238,800 | $134,900 | $103,900 |
Source: Public Records
Map
Nearby Homes
Your Personal Tour Guide
Ask me questions while you tour the home.