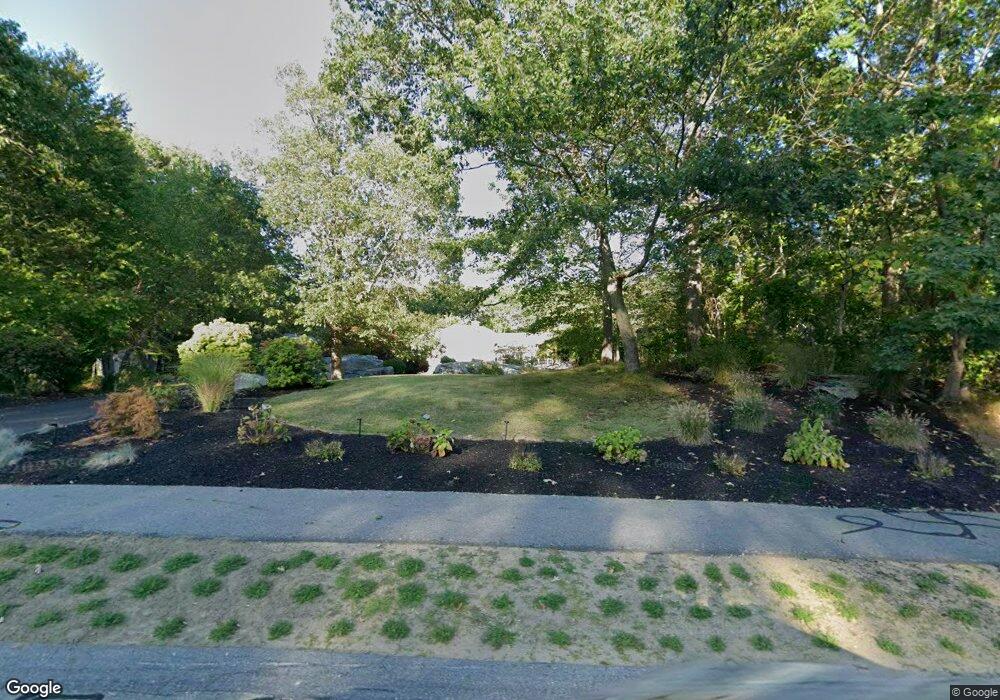
3 Castle View Dr Gloucester, MA 01930
West Gloucester NeighborhoodEstimated Value: $1,211,364 - $1,607,000
3
Beds
3
Baths
2,796
Sq Ft
$525/Sq Ft
Est. Value
About This Home
This home is located at 3 Castle View Dr, Gloucester, MA 01930 and is currently estimated at $1,468,341, approximately $525 per square foot. 3 Castle View Dr is a home located in Essex County with nearby schools including West Parish, Ralph B O'maley Middle School, and Gloucester High School.
Ownership History
Date
Name
Owned For
Owner Type
Purchase Details
Closed on
Mar 18, 2004
Sold by
Sakorafos Christopher and Sakorafos Robin
Bought by
Deltorchio Steve
Current Estimated Value
Home Financials for this Owner
Home Financials are based on the most recent Mortgage that was taken out on this home.
Original Mortgage
$560,000
Outstanding Balance
$262,452
Interest Rate
5.71%
Mortgage Type
Purchase Money Mortgage
Estimated Equity
$1,205,889
Purchase Details
Closed on
Jul 10, 2001
Sold by
Castleview Est Nt and Blyth Stephen M
Bought by
Sakorafos Christopher and Sakorafos Robin
Create a Home Valuation Report for This Property
The Home Valuation Report is an in-depth analysis detailing your home's value as well as a comparison with similar homes in the area
Home Values in the Area
Average Home Value in this Area
Purchase History
| Date | Buyer | Sale Price | Title Company |
|---|---|---|---|
| Deltorchio Steve | $700,000 | -- | |
| Sakorafos Christopher | $488,000 | -- |
Source: Public Records
Mortgage History
| Date | Status | Borrower | Loan Amount |
|---|---|---|---|
| Open | Sakorafos Christopher | $337,500 | |
| Closed | Sakorafos Christopher | $359,650 | |
| Open | Sakorafos Christopher | $560,000 |
Source: Public Records
Tax History
| Year | Tax Paid | Tax Assessment Tax Assessment Total Assessment is a certain percentage of the fair market value that is determined by local assessors to be the total taxable value of land and additions on the property. | Land | Improvement |
|---|---|---|---|---|
| 2025 | $9,085 | $934,700 | $322,700 | $612,000 |
| 2024 | $8,888 | $913,500 | $307,400 | $606,100 |
| 2023 | $9,085 | $857,900 | $274,300 | $583,600 |
| 2022 | $8,646 | $737,100 | $233,300 | $503,800 |
| 2021 | $8,473 | $681,100 | $212,300 | $468,800 |
| 2020 | $8,367 | $678,600 | $212,300 | $466,300 |
| 2019 | $8,454 | $666,200 | $212,300 | $453,900 |
| 2018 | $8,454 | $653,800 | $212,300 | $441,500 |
| 2017 | $9,629 | $730,000 | $310,900 | $419,100 |
| 2016 | $9,049 | $664,900 | $297,400 | $367,500 |
| 2015 | $8,512 | $623,600 | $290,600 | $333,000 |
Source: Public Records
Map
Nearby Homes
- 167 Atlantic St
- 226 Atlantic St
- 13 Honeysuckle Rd
- 672 Washington St
- 2 Finch Ln
- 7 Leaman Dr
- 5 Samoset Rd Unit B
- 7 Colburn St
- 368 Essex Ave
- 5 Lepage Ln
- 6 Monroe Ct
- 357 Concord St
- 98 Maplewood Ave
- 15 Harvard St
- 587 Essex Ave
- 84 Centennial Ave
- 40 Sargent St
- 33 Maplewood Ave Unit 16
- 20 Beacon St Unit 2
- 20 Beacon St Unit 1
- 9 Castle View Dr
- 14 Castle View Dr
- 1 Castle View Dr
- 6 Castle View Dr
- 6 Castle View Dr
- 5A Castle View Dr
- 8A Castle View Dr
- 10 Castle View Dr
- 4A Castle View Dr
- 1 Sea Fox Ln
- 2 Sea Fox Ln
- 0 Castleview Road Lot 8 Unit 70742669
- 164 Atlantic St
- 5 Schooner Ridge
- 3 Schooner Ridge
- 11 Atlantic Ave
- 7 Castle View Dr
- 156 Atlantic St
- 166 Atlantic St
- 7 Atlantic Ave
Your Personal Tour Guide
Ask me questions while you tour the home.