Estimated Value: $202,795 - $242,000
--
Bed
1
Bath
1,566
Sq Ft
$136/Sq Ft
Est. Value
About This Home
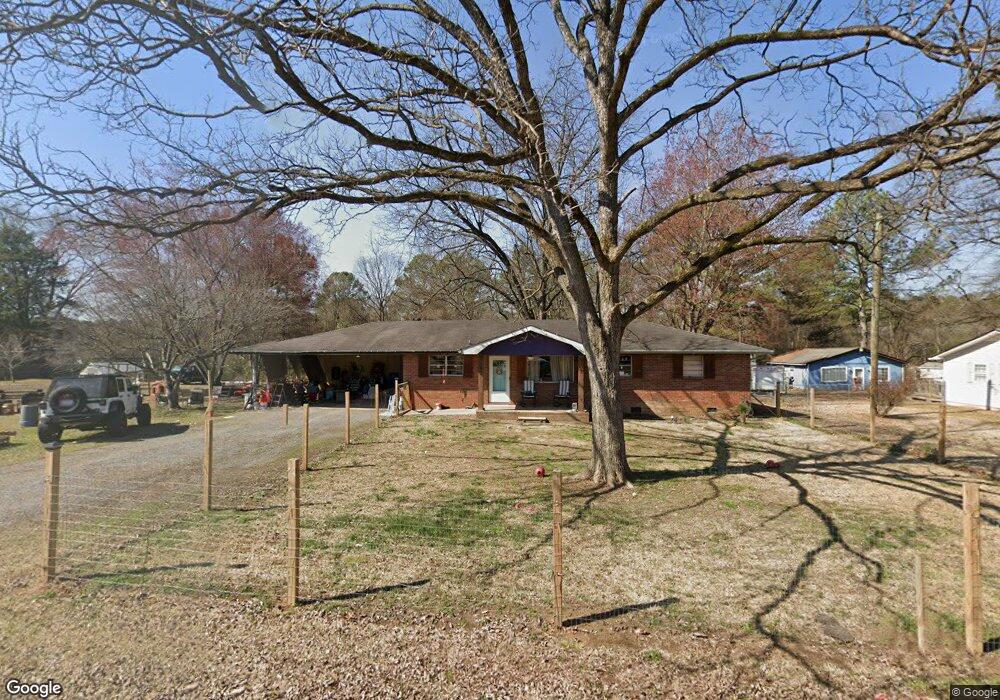
This home is located at 3 Cedar Ln NW, Rome, GA 30165 and is currently estimated at $213,449, approximately $136 per square foot. 3 Cedar Ln NW is a home located in Floyd County with nearby schools including Coosa Middle School and Coosa High School.
Ownership History
Date
Name
Owned For
Owner Type
Purchase Details
Closed on
Feb 3, 2023
Sold by
Reynolds Chad A
Bought by
Reynolds Chad A and Reynolds Amanda Jo
Current Estimated Value
Home Financials for this Owner
Home Financials are based on the most recent Mortgage that was taken out on this home.
Original Mortgage
$103,200
Interest Rate
6.48%
Mortgage Type
New Conventional
Purchase Details
Closed on
May 26, 2015
Sold by
Anderson Leola M
Bought by
Reynolds Chad A and Reynolds Paul R
Home Financials for this Owner
Home Financials are based on the most recent Mortgage that was taken out on this home.
Original Mortgage
$71,186
Interest Rate
4.25%
Mortgage Type
FHA
Purchase Details
Closed on
Jan 1, 1977
Sold by
Alexander Effie M
Bought by
Anderson Leola
Purchase Details
Closed on
Mar 29, 1976
Sold by
Anderson E E Leola
Bought by
Alexander Effie M
Purchase Details
Closed on
Jul 24, 1972
Sold by
Lambert Edward E
Bought by
Anderson E E Leola
Purchase Details
Closed on
Jun 19, 1961
Bought by
Lambert Edward E
Create a Home Valuation Report for This Property
The Home Valuation Report is an in-depth analysis detailing your home's value as well as a comparison with similar homes in the area
Home Values in the Area
Average Home Value in this Area
Purchase History
| Date | Buyer | Sale Price | Title Company |
|---|---|---|---|
| Reynolds Chad A | -- | -- | |
| Reynolds Chad A | $68,800 | -- | |
| Anderson Leola | -- | -- | |
| Alexander Effie M | -- | -- | |
| Anderson E E Leola | $1,300 | -- | |
| Lambert Edward E | -- | -- |
Source: Public Records
Mortgage History
| Date | Status | Borrower | Loan Amount |
|---|---|---|---|
| Previous Owner | Reynolds Chad A | $103,200 | |
| Previous Owner | Reynolds Chad A | $71,186 |
Source: Public Records
Tax History Compared to Growth
Tax History
| Year | Tax Paid | Tax Assessment Tax Assessment Total Assessment is a certain percentage of the fair market value that is determined by local assessors to be the total taxable value of land and additions on the property. | Land | Improvement |
|---|---|---|---|---|
| 2024 | $1,338 | $56,911 | $5,242 | $51,669 |
| 2023 | $1,319 | $54,791 | $4,493 | $50,298 |
| 2022 | $1,201 | $46,166 | $3,744 | $42,422 |
| 2021 | $1,124 | $41,215 | $3,744 | $37,471 |
| 2020 | $1,087 | $38,893 | $2,995 | $35,898 |
| 2019 | $1,040 | $37,204 | $2,995 | $34,209 |
| 2018 | $1,008 | $35,461 | $2,995 | $32,466 |
| 2017 | $994 | $34,571 | $2,995 | $31,576 |
| 2016 | $796 | $34,080 | $2,960 | $31,120 |
| 2015 | $206 | $30,214 | $2,960 | $27,254 |
| 2014 | $206 | $30,214 | $2,960 | $27,254 |
Source: Public Records
Map
Nearby Homes
- 43 Brownlow Dr NW
- 0 Alabama Hwy Unit 10590171
- 0 Alabama Hwy Unit 7635346
- 0 Alabama Hwy Unit 7494552
- 33 Cedar Ln NW
- 31 Cedar Ln NW
- 4813 Alabama Hwy SW
- 10 Nest Dr NW
- 48 Atwood Dr NW
- 36 Stargazer Trail NW
- 4485 Alabama Hwy
- 8 Kayla Dr NW
- 5 Red Fox Dr SW
- 775 Mays Bridge Rd SW
- 1 Ann Dr NW
- 26 Red Fox Dr SW
- 458 Kraftsman Rd SW
- 293 N Avery Rd NW
- 45 Albert Ave NW
- 86 N Avery Rd NW
- 3 Cedar Ln NW
- 5 Cedar Ln NW
- 7 Cedar Ln NW
- 4 Cedar Ln NW
- 6 Cedar Ln NW
- 2 Cedar Ln NW
- 6 Althea Dr NW
- 8 Althea Dr NW
- 10 Althea Dr NW
- 8 Cedar Ln NW
- 4 Althea Dr NW
- 7 Martin Rd NW
- 5 Martin Rd NW
- 12 Althea Dr NW
- 4 Mulberry Rd NW
- 4 Mulberry Rd NW
- 3 Martin Rd NW Unit 6
- 3 Martin Rd NW
- 13 Martin Rd NW
- 13 Martin Rd NW