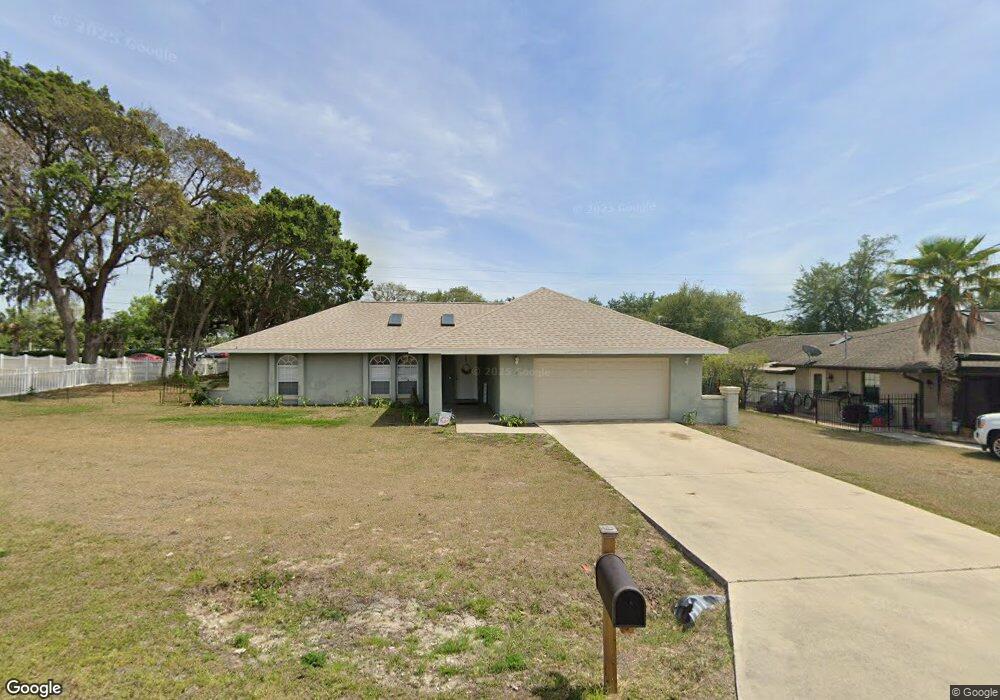
3 Cedar Trace Pass Ocala, FL 34472
Silver Spring Shores NeighborhoodEstimated Value: $222,000 - $246,000
3
Beds
2
Baths
1,593
Sq Ft
$149/Sq Ft
Est. Value
About This Home
This home is located at 3 Cedar Trace Pass, Ocala, FL 34472 and is currently estimated at $236,654, approximately $148 per square foot. 3 Cedar Trace Pass is a home located in Marion County with nearby schools including Legacy Elementary School, Lake Weir Middle School, and Lake Weir High School.
Ownership History
Date
Name
Owned For
Owner Type
Purchase Details
Closed on
Jul 31, 2014
Sold by
Bbnt Reo Holdings Llc and Bbnt Reo Capital Llc
Bought by
Kennedy John J and Kennedy Liliana R
Current Estimated Value
Purchase Details
Closed on
Jun 24, 2014
Sold by
Fung Natasha and Seepaul Victor
Bought by
Bbnt Reo Capital Llc
Purchase Details
Closed on
May 25, 2007
Sold by
Fung Natasha and Seepaul Victor
Bought by
Fung Natasha and Seepaul Victor
Home Financials for this Owner
Home Financials are based on the most recent Mortgage that was taken out on this home.
Original Mortgage
$132,720
Interest Rate
6.16%
Mortgage Type
New Conventional
Purchase Details
Closed on
Sep 29, 2003
Sold by
Bank One Na
Bought by
Fung Natasha and Seepaul Victor
Home Financials for this Owner
Home Financials are based on the most recent Mortgage that was taken out on this home.
Original Mortgage
$59,920
Interest Rate
8.15%
Mortgage Type
Purchase Money Mortgage
Purchase Details
Closed on
May 29, 2003
Sold by
Durden Ernest L
Bought by
Bank One Na
Create a Home Valuation Report for This Property
The Home Valuation Report is an in-depth analysis detailing your home's value as well as a comparison with similar homes in the area
Home Values in the Area
Average Home Value in this Area
Purchase History
| Date | Buyer | Sale Price | Title Company |
|---|---|---|---|
| Kennedy John J | $77,000 | -- | |
| Bbnt Reo Capital Llc | $44,100 | Attorney | |
| Fung Natasha | -- | Attorney | |
| Fung Natasha | $74,900 | -- | |
| Bank One Na | -- | -- |
Source: Public Records
Mortgage History
| Date | Status | Borrower | Loan Amount |
|---|---|---|---|
| Previous Owner | Fung Natasha | $132,720 | |
| Previous Owner | Fung Natasha | $59,920 |
Source: Public Records
Tax History
| Year | Tax Paid | Tax Assessment Tax Assessment Total Assessment is a certain percentage of the fair market value that is determined by local assessors to be the total taxable value of land and additions on the property. | Land | Improvement |
|---|---|---|---|---|
| 2025 | $3,637 | $188,845 | -- | -- |
| 2024 | $3,262 | $171,677 | -- | -- |
| 2023 | $3,186 | $156,070 | $0 | $0 |
| 2022 | $2,865 | $141,882 | $0 | $0 |
| 2021 | $2,538 | $139,812 | $8,000 | $131,812 |
| 2020 | $2,323 | $122,461 | $6,500 | $115,961 |
| 2019 | $2,149 | $109,275 | $6,500 | $102,775 |
| 2018 | $1,949 | $103,486 | $5,500 | $97,986 |
| 2017 | $1,865 | $101,941 | $5,500 | $96,441 |
| 2016 | $1,702 | $79,737 | $0 | $0 |
| 2015 | $1,517 | $72,171 | $0 | $0 |
| 2014 | $1,368 | $64,099 | $0 | $0 |
Source: Public Records
Map
Nearby Homes
- TBD Midway Ct
- 18 Midway Ct
- 4 Cedar Trace Way
- 25 Cedar Trace
- 0 Cedar Radial Pass
- 5 Cedar Trace Ln
- Lot 37 Cedar Trace Ln
- 00 Cedar Rd
- 0 Cedar Rd Unit MFROM694847
- 20 Cedar Rd
- 15 Cedar Trace Trail
- 0 Midway Rd Unit MFRS5141000
- 0 Midway Rd Unit MFRG5075560
- 0 Midway Rd Unit MFRS5140986
- 2 Pine Course Trail
- 0 Cedar Tree Terrace Unit 11549268
- 0 Cedar Tree Terrace Unit MFRS5132070
- 0 Cedar Ln
- 0 SE Maricamp Rd Unit MFROM691362
- 0 SE Maricamp Rd Unit MFROM694100
- 1 Cedar Trace Pass
- 5 Cedar Trace Pass
- 4 Cedar Trace Pass Unit 9
- 2 Cedar Trace Pass
- 6 Cedar Trace Pass
- 1 Cedar Trace Dr
- 4 Midway Ct
- 8 Midway Ct
- 1 Midway Ct
- 3 Midway Ct
- 3 Midway Ct Unit 9
- 5 Midway Ct
- 9 Midway Ct
- 14 Midway Ct
- 9 Midway Ct
- 7 Cedar Tree Ln
- 5 Cedar Trace Way
- 11 Midway Ct Unit 9
- 7 Cedar Trace Way
- 1 Cedar Trace Way