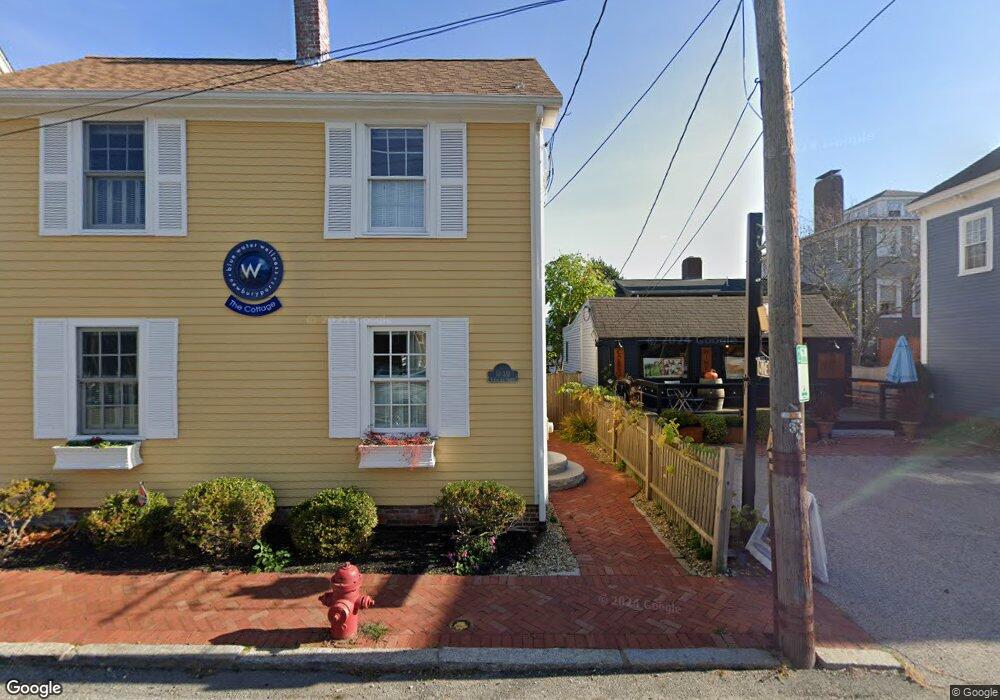
3 Center St Newburyport, MA 01950
Estimated Value: $887,341
2
Beds
1
Bath
900
Sq Ft
$986/Sq Ft
Est. Value
About This Home
This home is located at 3 Center St, Newburyport, MA 01950 and is currently estimated at $887,341, approximately $985 per square foot. 3 Center St is a home located in Essex County with nearby schools including Francis T. Bresnahan Elementary School, Edward G. Molin Elementary School, and Rupert A. Nock Middle School.
Ownership History
Date
Name
Owned For
Owner Type
Purchase Details
Closed on
Jun 21, 2019
Sold by
Ablow Keith R
Bought by
Kra Nt
Current Estimated Value
Purchase Details
Closed on
Jun 27, 2002
Sold by
Molin Joshua D and Molin Kimberly D
Bought by
Dickes Wendy L
Purchase Details
Closed on
Jul 7, 1998
Sold by
Boland David B and Boland Kimberly J
Bought by
Molin Joshua D and Molin Douglas E
Purchase Details
Closed on
Dec 20, 1996
Sold by
Mcnulty Lois A
Bought by
Boland Kimberly L and Boland David B
Purchase Details
Closed on
Jun 7, 1995
Sold by
Hood Chester A and Hood Janice E
Bought by
Hood Barry A
Purchase Details
Closed on
Jul 1, 1988
Sold by
Mcgrath William F
Bought by
Ventre Frances
Create a Home Valuation Report for This Property
The Home Valuation Report is an in-depth analysis detailing your home's value as well as a comparison with similar homes in the area
Home Values in the Area
Average Home Value in this Area
Purchase History
| Date | Buyer | Sale Price | Title Company |
|---|---|---|---|
| Kra Nt | -- | -- | |
| Dickes Wendy L | $296,000 | -- | |
| Dickes Wendy L | $296,000 | -- | |
| Molin Joshua D | $149,900 | -- | |
| Molin Joshua D | $149,900 | -- | |
| Boland Kimberly L | $137,000 | -- | |
| Boland Kimberly L | $137,000 | -- | |
| Hood Barry A | $115,000 | -- | |
| Hood Barry A | $115,000 | -- | |
| Ventre Frances | $123,500 | -- |
Source: Public Records
Mortgage History
| Date | Status | Borrower | Loan Amount |
|---|---|---|---|
| Previous Owner | Ventre Frances | $356,000 |
Source: Public Records
Tax History Compared to Growth
Tax History
| Year | Tax Paid | Tax Assessment Tax Assessment Total Assessment is a certain percentage of the fair market value that is determined by local assessors to be the total taxable value of land and additions on the property. | Land | Improvement |
|---|---|---|---|---|
| 2025 | $7,119 | $743,100 | $333,700 | $409,400 |
| 2024 | $6,923 | $694,400 | $303,400 | $391,000 |
| 2023 | $6,436 | $599,300 | $263,800 | $335,500 |
| 2022 | $5,360 | $446,300 | $219,800 | $226,500 |
| 2021 | $5,179 | $409,700 | $199,800 | $209,900 |
| 2020 | $5,261 | $409,700 | $199,800 | $209,900 |
| 2019 | $5,122 | $391,600 | $199,800 | $191,800 |
| 2018 | $4,889 | $368,700 | $190,300 | $178,400 |
| 2017 | $4,837 | $359,600 | $181,200 | $178,400 |
| 2016 | $4,389 | $327,800 | $172,600 | $155,200 |
| 2015 | $4,239 | $317,800 | $172,600 | $145,200 |
Source: Public Records
Map
Nearby Homes
- 10 10th St
- 14 Spring St
- 42 Federal St Unit B
- 9 Orange St Unit 1
- 9 Orange St
- 11 Orange St Unit 1
- 15 Beck St Unit 1
- 15 Beck St
- 4 School St
- 58 Lime St Unit 5
- 2 Court St Unit 4
- 95 High St Unit 4
- 2 Scholtz Terrace
- 78 High St
- 166 Water St Unit B
- 164 Water St
- 164 Water St Unit A
- 175 Bridge Rd
- 111 Prospect St Unit A
- 113 Prospect St Unit B
- 3 1/2 Center St
- 1 Center St
- 36 Water St
- 5 1/2 Center St
- 8 Pike St
- 7 Pike St
- 10 Pike St
- 9 Center St
- 9 Pike St
- 30 Water St Unit 6
- 30 Water St Unit 32
- 30 Water St Unit 32
- 30 Water St Unit 32
- 30 Water St Unit 32
- 30-32 Water St Unit 5
- 30-32 Water St Unit 6,1
- 30-32 Water St Unit 4,1
- 30-32 Water St Unit 6
- 30-32 Water St Unit 7/1
- 30 Water St Unit 7