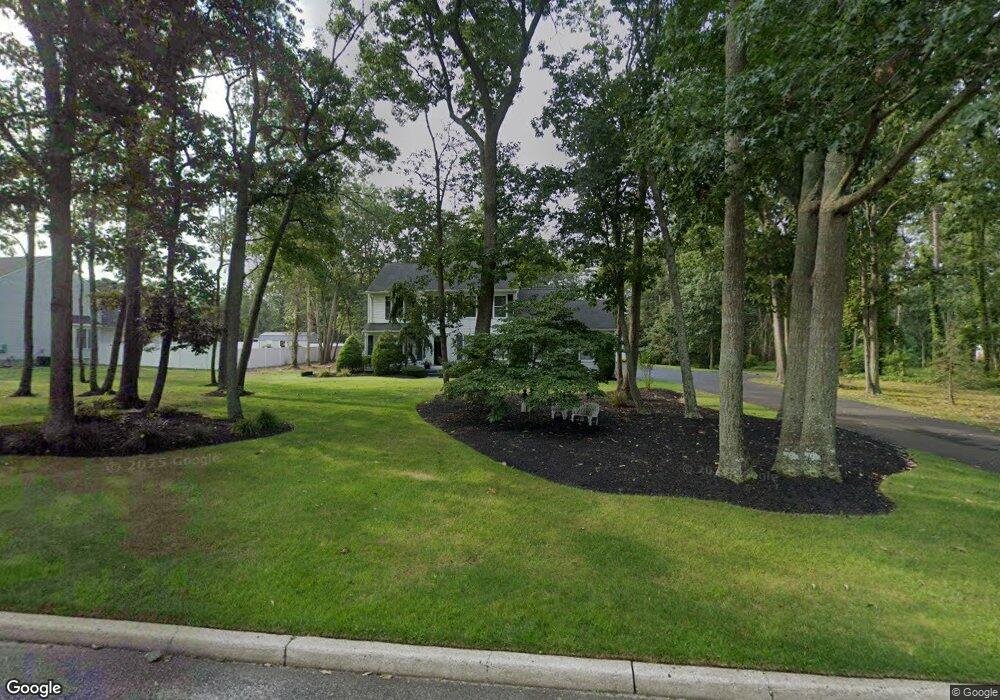
3 Chadwyn Dr Ocean View, NJ 08230
Estimated Value: $559,941 - $717,000
--
Bed
--
Bath
2,612
Sq Ft
$256/Sq Ft
Est. Value
About This Home
This home is located at 3 Chadwyn Dr, Ocean View, NJ 08230 and is currently estimated at $667,985, approximately $255 per square foot. 3 Chadwyn Dr is a home located in Cape May County with nearby schools including Upper Township Primary School, Upper Township Elementary School, and Upper Township Middle School.
Ownership History
Date
Name
Owned For
Owner Type
Purchase Details
Closed on
Feb 24, 1989
Sold by
Aldon Homes Inc
Bought by
Reighn Ronald and Reighn Margaret
Current Estimated Value
Purchase Details
Closed on
Dec 24, 1988
Bought by
Reighn Ronald B and Reighn Margaret M
Create a Home Valuation Report for This Property
The Home Valuation Report is an in-depth analysis detailing your home's value as well as a comparison with similar homes in the area
Home Values in the Area
Average Home Value in this Area
Purchase History
| Date | Buyer | Sale Price | Title Company |
|---|---|---|---|
| Reighn Ronald | $179,400 | -- | |
| Reighn Ronald B | $179,400 | -- |
Source: Public Records
Tax History Compared to Growth
Tax History
| Year | Tax Paid | Tax Assessment Tax Assessment Total Assessment is a certain percentage of the fair market value that is determined by local assessors to be the total taxable value of land and additions on the property. | Land | Improvement |
|---|---|---|---|---|
| 2025 | $8,638 | $376,400 | $137,900 | $238,500 |
| 2024 | $8,638 | $376,400 | $137,900 | $238,500 |
| 2023 | $8,213 | $376,400 | $137,900 | $238,500 |
| 2022 | $7,912 | $376,400 | $137,900 | $238,500 |
| 2021 | $5,647 | $376,400 | $137,900 | $238,500 |
| 2020 | $7,336 | $376,400 | $137,900 | $238,500 |
| 2019 | $7,140 | $376,400 | $137,900 | $238,500 |
| 2018 | $6,952 | $376,400 | $137,900 | $238,500 |
| 2017 | $6,592 | $361,400 | $137,900 | $223,500 |
| 2016 | $6,448 | $347,600 | $137,900 | $209,700 |
| 2015 | $6,274 | $347,600 | $137,900 | $209,700 |
| 2014 | $6,787 | $461,100 | $218,600 | $242,500 |
Source: Public Records
Map
Nearby Homes