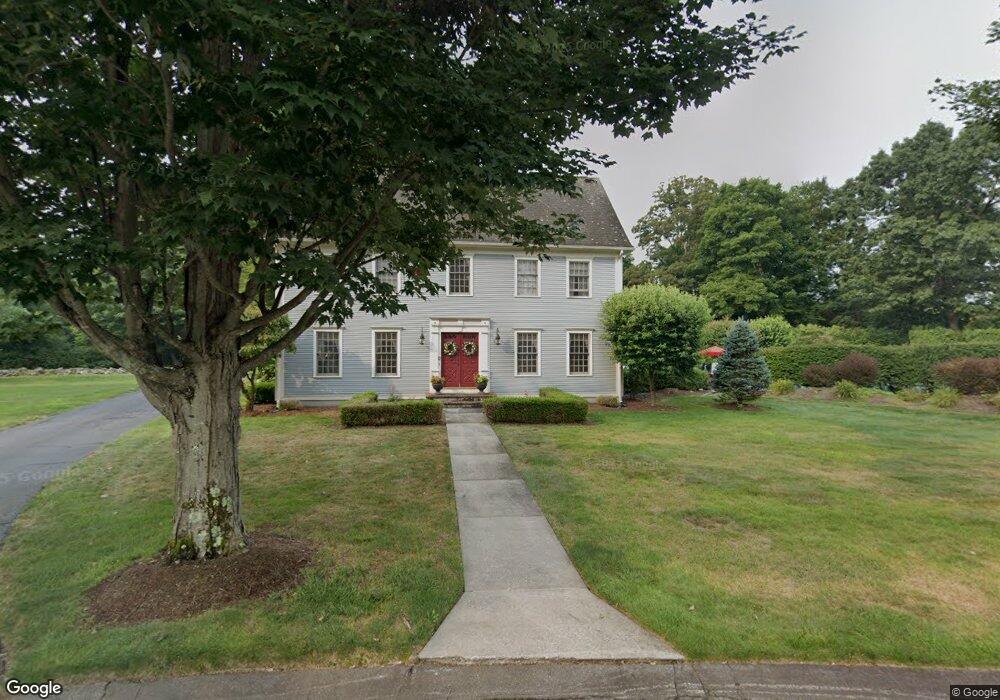
3 Chatham Trace Cir Wilbraham, MA 01095
Estimated Value: $655,658 - $700,000
4
Beds
3
Baths
2,516
Sq Ft
$269/Sq Ft
Est. Value
About This Home
This home is located at 3 Chatham Trace Cir, Wilbraham, MA 01095 and is currently estimated at $677,915, approximately $269 per square foot. 3 Chatham Trace Cir is a home located in Hampden County with nearby schools including Minnechaug Regional High School, Springfield International Charter School, and Wilbraham & Monson Academy.
Ownership History
Date
Name
Owned For
Owner Type
Purchase Details
Closed on
Nov 21, 2022
Sold by
Obrien Francis X
Bought by
Obrien Ellen
Current Estimated Value
Purchase Details
Closed on
Dec 23, 1997
Sold by
Lacombe Philip M and Lacombe Dawn M
Bought by
Obrien Francis X
Home Financials for this Owner
Home Financials are based on the most recent Mortgage that was taken out on this home.
Original Mortgage
$100,000
Interest Rate
7.14%
Mortgage Type
Purchase Money Mortgage
Purchase Details
Closed on
Dec 23, 1996
Sold by
Pecoy Kent W
Bought by
Lacombe Philip M and Lacombe Dawn M
Home Financials for this Owner
Home Financials are based on the most recent Mortgage that was taken out on this home.
Original Mortgage
$333,000
Interest Rate
7.62%
Mortgage Type
Purchase Money Mortgage
Create a Home Valuation Report for This Property
The Home Valuation Report is an in-depth analysis detailing your home's value as well as a comparison with similar homes in the area
Home Values in the Area
Average Home Value in this Area
Purchase History
| Date | Buyer | Sale Price | Title Company |
|---|---|---|---|
| Obrien Ellen | -- | None Available | |
| Obrien Francis X | $363,000 | -- | |
| Lacombe Philip M | $75,000 | -- | |
| Pecoy Kent W | $100,000 | -- |
Source: Public Records
Mortgage History
| Date | Status | Borrower | Loan Amount |
|---|---|---|---|
| Previous Owner | Pecoy Kent W | $384,000 | |
| Previous Owner | Pecoy Kent W | $384,000 | |
| Previous Owner | Pecoy Kent W | $100,000 | |
| Previous Owner | Pecoy Kent W | $333,000 |
Source: Public Records
Tax History Compared to Growth
Tax History
| Year | Tax Paid | Tax Assessment Tax Assessment Total Assessment is a certain percentage of the fair market value that is determined by local assessors to be the total taxable value of land and additions on the property. | Land | Improvement |
|---|---|---|---|---|
| 2025 | $10,762 | $601,900 | $127,500 | $474,400 |
| 2024 | $10,591 | $572,500 | $127,500 | $445,000 |
| 2023 | $9,591 | $516,700 | $127,500 | $389,200 |
| 2022 | $9,591 | $468,100 | $127,500 | $340,600 |
| 2021 | $10,392 | $452,600 | $143,700 | $308,900 |
| 2020 | $10,129 | $452,600 | $143,700 | $308,900 |
| 2019 | $9,869 | $452,700 | $143,700 | $309,000 |
| 2018 | $9,853 | $435,200 | $143,700 | $291,500 |
| 2017 | $9,574 | $435,200 | $143,700 | $291,500 |
| 2016 | $9,113 | $421,900 | $148,500 | $273,400 |
| 2015 | $8,809 | $421,900 | $148,500 | $273,400 |
Source: Public Records
Map
Nearby Homes
- 1028 Tinkham Rd
- 6 Katie St
- 68 Monson Rd
- 230V Burleigh Rd
- 17 Peak Rd
- 5 Old Carriage Dr
- 767 Stony Hill Rd
- 760 Stony Hill Rd
- 763 Stony Hill Rd
- 6 Hilltop Park
- 14 Brookdale Dr
- 19 Forest Hill Rd
- 751 Ridge Rd
- 374
- 407 Monson Rd
- 12 Highridge Rd
- 5 Edgewood Rd
- 8 Patriot Ridge Ln
- 390 Soule Rd
- 2 Bayberry Dr Unit 51