Estimated Value: $199,314 - $281,000
5
Beds
4
Baths
2,800
Sq Ft
$86/Sq Ft
Est. Value
About This Home
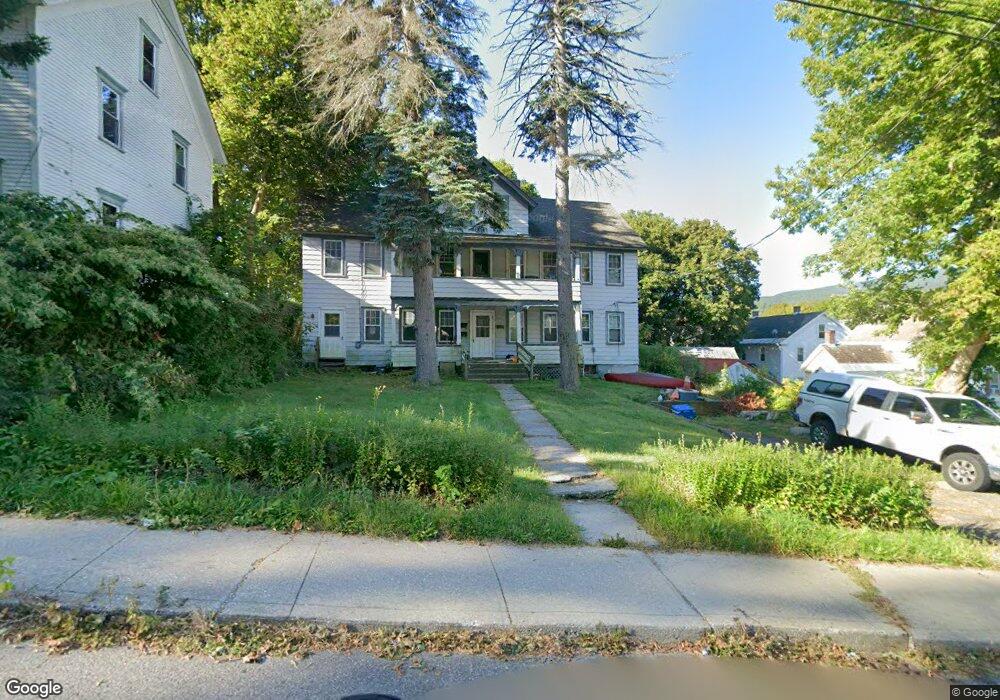
This home is located at 3 Cherry St, Adams, MA 01220 and is currently estimated at $240,079, approximately $85 per square foot. 3 Cherry St is a home located in Berkshire County with nearby schools including Hoosac Valley Middle & High School, Berkshire Arts & Technology Charter Public School, and St. Stanislaus Kostka School.
Ownership History
Date
Name
Owned For
Owner Type
Purchase Details
Closed on
Jan 5, 2005
Sold by
Keyburn Gobel John R and Keyburn Hollister P
Bought by
Rowe Mark F
Current Estimated Value
Home Financials for this Owner
Home Financials are based on the most recent Mortgage that was taken out on this home.
Original Mortgage
$87,300
Outstanding Balance
$44,076
Interest Rate
5.75%
Mortgage Type
Purchase Money Mortgage
Estimated Equity
$196,003
Create a Home Valuation Report for This Property
The Home Valuation Report is an in-depth analysis detailing your home's value as well as a comparison with similar homes in the area
Home Values in the Area
Average Home Value in this Area
Purchase History
| Date | Buyer | Sale Price | Title Company |
|---|---|---|---|
| Rowe Mark F | $90,000 | -- |
Source: Public Records
Mortgage History
| Date | Status | Borrower | Loan Amount |
|---|---|---|---|
| Open | Rowe Mark F | $87,300 |
Source: Public Records
Tax History
| Year | Tax Paid | Tax Assessment Tax Assessment Total Assessment is a certain percentage of the fair market value that is determined by local assessors to be the total taxable value of land and additions on the property. | Land | Improvement |
|---|---|---|---|---|
| 2025 | $3,383 | $198,900 | $39,500 | $159,400 |
| 2024 | $3,185 | $181,600 | $37,100 | $144,500 |
| 2023 | $2,966 | $159,900 | $34,100 | $125,800 |
| 2022 | $2,887 | $138,200 | $29,600 | $108,600 |
| 2021 | $3,051 | $134,900 | $29,600 | $105,300 |
| 2020 | $2,928 | $133,800 | $29,600 | $104,200 |
| 2019 | $2,862 | $133,800 | $29,600 | $104,200 |
| 2018 | $2,927 | $131,800 | $29,600 | $102,200 |
| 2017 | $2,817 | $131,800 | $29,600 | $102,200 |
| 2016 | $2,633 | $123,100 | $29,600 | $93,500 |
| 2015 | $2,564 | $120,000 | $31,200 | $88,800 |
| 2014 | $2,394 | $120,000 | $31,200 | $88,800 |
Source: Public Records
Map
Nearby Homes
Your Personal Tour Guide
Ask me questions while you tour the home.