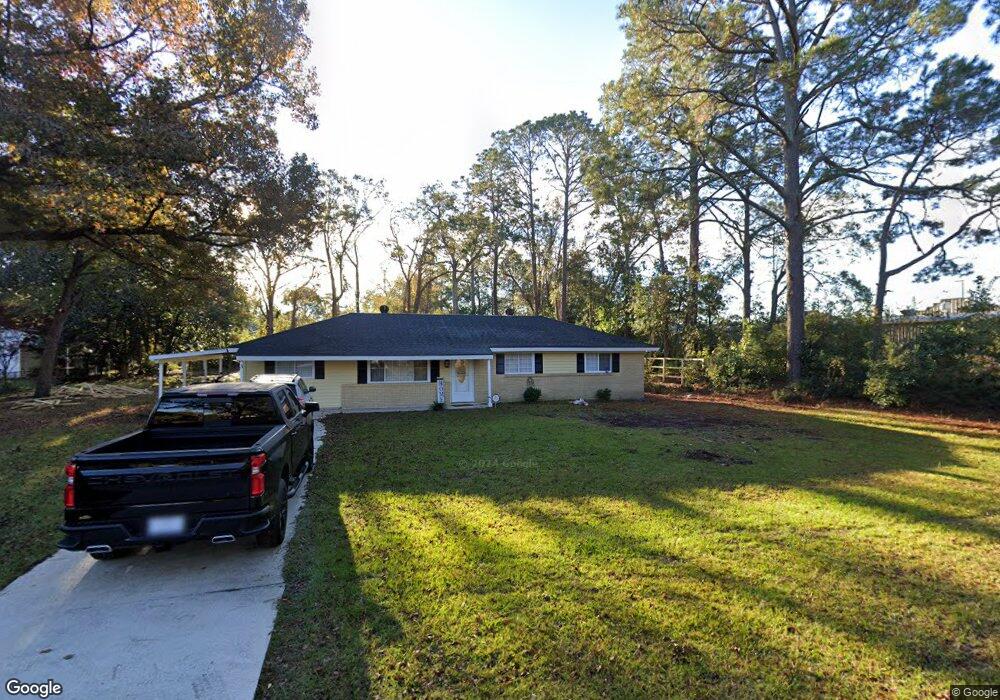
3 Cherry St Hinesville, GA 31313
Estimated Value: $210,785 - $260,000
3
Beds
2
Baths
2,070
Sq Ft
$114/Sq Ft
Est. Value
About This Home
This home is located at 3 Cherry St, Hinesville, GA 31313 and is currently estimated at $235,446, approximately $113 per square foot. 3 Cherry St is a home located in Liberty County with nearby schools including Waldo Pafford Elementary School, Snelson-Golden Middle School, and Bradwell Institute.
Ownership History
Date
Name
Owned For
Owner Type
Purchase Details
Closed on
Aug 7, 2024
Sold by
Alliance Park Llc
Bought by
Virrueta Armando I
Current Estimated Value
Home Financials for this Owner
Home Financials are based on the most recent Mortgage that was taken out on this home.
Original Mortgage
$250,267
Outstanding Balance
$247,380
Interest Rate
6.77%
Mortgage Type
New Conventional
Estimated Equity
-$11,934
Purchase Details
Closed on
Dec 28, 2011
Sold by
Denis Marjorie
Bought by
Alliance Park Llc
Purchase Details
Closed on
Dec 27, 2005
Sold by
Reip David A
Bought by
Denis Marjorie
Purchase Details
Closed on
Aug 4, 1992
Bought by
Applegate Michelle
Purchase Details
Closed on
Mar 18, 1992
Bought by
Secretary Of V A
Purchase Details
Closed on
Sep 30, 1991
Bought by
Itt Financial Svc
Create a Home Valuation Report for This Property
The Home Valuation Report is an in-depth analysis detailing your home's value as well as a comparison with similar homes in the area
Home Values in the Area
Average Home Value in this Area
Purchase History
| Date | Buyer | Sale Price | Title Company |
|---|---|---|---|
| Virrueta Armando I | $245,000 | -- | |
| Alliance Park Llc | -- | -- | |
| Denis Marjorie | $129,000 | -- | |
| Applegate Michelle | $48,000 | -- | |
| Secretary Of V A | -- | -- | |
| Itt Financial Svc | -- | -- |
Source: Public Records
Mortgage History
| Date | Status | Borrower | Loan Amount |
|---|---|---|---|
| Open | Virrueta Armando I | $250,267 |
Source: Public Records
Tax History
| Year | Tax Paid | Tax Assessment Tax Assessment Total Assessment is a certain percentage of the fair market value that is determined by local assessors to be the total taxable value of land and additions on the property. | Land | Improvement |
|---|---|---|---|---|
| 2024 | $4,418 | $63,883 | $14,000 | $49,883 |
| 2023 | $3,141 | $53,887 | $12,000 | $41,887 |
| 2022 | $2,092 | $44,806 | $10,000 | $34,806 |
| 2021 | $1,868 | $39,248 | $7,200 | $32,048 |
| 2020 | $1,912 | $39,806 | $7,200 | $32,606 |
| 2019 | $1,924 | $40,364 | $7,200 | $33,164 |
| 2018 | $1,938 | $40,889 | $7,200 | $33,689 |
| 2017 | $1,308 | $39,707 | $7,200 | $32,507 |
| 2016 | $1,817 | $40,219 | $7,200 | $33,019 |
| 2015 | $1,674 | $35,615 | $6,200 | $29,415 |
| 2014 | $1,674 | $36,619 | $7,200 | $29,419 |
| 2013 | -- | $36,619 | $7,200 | $29,419 |
Source: Public Records
Map
Nearby Homes
- 9 Cherry St
- 0 Weeping Willow Dr
- .77 AC Veterans Pkwy
- 84 Beaumont Dr
- 221 Heirloom Rd
- 74 Beaumont Dr
- 229 Pitchline Dr
- 180 Pitchline Dr
- 226 Pitchline Dr
- 22 Oak St
- 614 Demere St
- 0 County Line Rd Unit 1644022
- 0 County Line Rd Unit 18961791
- 722 Bacon Rd
- 903 Canyon Ct
- 915 Mandarin Dr
- 313 Deal St
- 740 Robin Hood Dr
- 917 Malibu Dr
- 901 Pintail Ct
- 3.47 Ac Cherrie Murrell St St
- 3 Cherry St
- 3 Cherry St
- 5 Cherry St
- 790 Veterans Pkwy Unit 109
- 790 Veterans Pkwy Unit 104
- 790 Veterans Pkwy
- 2 Elm St
- 7 Cherry St
- 2 Cherry St
- 4 Cherry St
- 55 Willowbrook Dr
- 6 Cherry St
- 6 Elm St
- 8 Cherry St
- 5 Elm St
- 13 Palm Dr
- 5 Dogwood St
- 3 Elm St
- 0 Veterans Park Unit 121923
Your Personal Tour Guide
Ask me questions while you tour the home.