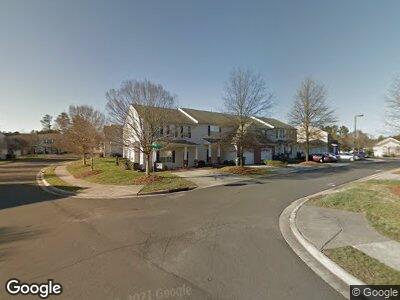
3 Chowings St Durham, NC 27713
Woodcroft NeighborhoodEstimated Value: $341,000 - $374,000
3
Beds
3
Baths
1,643
Sq Ft
$221/Sq Ft
Est. Value
About This Home
This home is located at 3 Chowings St, Durham, NC 27713 and is currently estimated at $362,495, approximately $220 per square foot. 3 Chowings St is a home located in Durham County with nearby schools including Pearsontown Elementary School, Lowe's Grove Middle, and Hillside High School.
Ownership History
Date
Name
Owned For
Owner Type
Purchase Details
Closed on
Sep 20, 2022
Sold by
Layers Ii Richard L and Layers Rebeca Delia
Bought by
Mckinley Ewan Lowell
Current Estimated Value
Home Financials for this Owner
Home Financials are based on the most recent Mortgage that was taken out on this home.
Original Mortgage
$354,050
Outstanding Balance
$340,993
Interest Rate
5.22%
Mortgage Type
New Conventional
Estimated Equity
$21,502
Purchase Details
Closed on
Oct 22, 2003
Sold by
South Trust Bank
Bought by
Ayers Ii Richard L
Home Financials for this Owner
Home Financials are based on the most recent Mortgage that was taken out on this home.
Original Mortgage
$145,000
Interest Rate
4.67%
Mortgage Type
Purchase Money Mortgage
Purchase Details
Closed on
Aug 15, 2003
Sold by
First State Service Corp
Bought by
Southtrust Bank
Purchase Details
Closed on
Oct 18, 2001
Sold by
Crossman Communities North Carolina Inc
Bought by
Meade Bryan Derek
Home Financials for this Owner
Home Financials are based on the most recent Mortgage that was taken out on this home.
Original Mortgage
$132,386
Interest Rate
6.85%
Create a Home Valuation Report for This Property
The Home Valuation Report is an in-depth analysis detailing your home's value as well as a comparison with similar homes in the area
Home Values in the Area
Average Home Value in this Area
Purchase History
| Date | Buyer | Sale Price | Title Company |
|---|---|---|---|
| Mckinley Ewan Lowell | $365,000 | -- | |
| Ayers Ii Richard L | $145,000 | -- | |
| Southtrust Bank | $143,280 | -- | |
| Meade Bryan Derek | $133,500 | -- |
Source: Public Records
Mortgage History
| Date | Status | Borrower | Loan Amount |
|---|---|---|---|
| Open | Mckinley Ewan Lowell | $354,050 | |
| Previous Owner | Ayers Ii Richard L | $145,000 | |
| Previous Owner | Meade Bryan Derek | $132,386 |
Source: Public Records
Tax History Compared to Growth
Tax History
| Year | Tax Paid | Tax Assessment Tax Assessment Total Assessment is a certain percentage of the fair market value that is determined by local assessors to be the total taxable value of land and additions on the property. | Land | Improvement |
|---|---|---|---|---|
| 2024 | $2,800 | $200,756 | $40,000 | $160,756 |
| 2023 | $2,630 | $200,756 | $40,000 | $160,756 |
| 2022 | $2,569 | $200,756 | $40,000 | $160,756 |
| 2021 | $2,557 | $200,756 | $40,000 | $160,756 |
| 2020 | $2,497 | $200,756 | $40,000 | $160,756 |
| 2019 | $2,497 | $200,756 | $40,000 | $160,756 |
| 2018 | $2,166 | $159,677 | $30,000 | $129,677 |
| 2017 | $2,150 | $159,677 | $30,000 | $129,677 |
| 2016 | $2,078 | $159,677 | $30,000 | $129,677 |
| 2015 | $2,387 | $172,459 | $34,400 | $138,059 |
| 2014 | $2,387 | $172,459 | $34,400 | $138,059 |
Source: Public Records
Map
Nearby Homes
- 6 Newgate Ct
- 101 Whitney Ln
- 1003 Crimson Dr Unit 2
- 211 Whitney Ln
- 1208 Copper Creek Dr
- 1122 Vermillion Dr
- 6502 Barbee Rd
- 5624 Barbee Rd
- 1017 Red Hat Ln
- 1022 Flagler St
- 1408 Fairmont St
- 5829 Sandstone Dr
- 1048 Flagler St
- 909 Windcrest Rd
- 1238 Exchange Place
- 1129 Kudzu St
- 11 Bridgeport Dr
- 901 Forge Rd
- 1003 Canary Pepper Dr
- 1016 Mirbeck Ln
- 3 Chowings St
- 3 Chownings St
- 1 Chownings St
- 1 Chowings St
- 5 Chownings St
- 7 Chownings St
- 11 Chownings St
- 2 Brafferton Ct
- 4 Brafferton Ct
- 2 Chownings St
- 2 Chowings St
- 4 Chownings St
- 4 Chowings St
- 237 Basset Hall Dr
- 8 Brafferton Ct
- 13 Chownings St
- 6 Chownings St
- 6 Chowings St
- 8 Chownings St
- 15 Chowings St