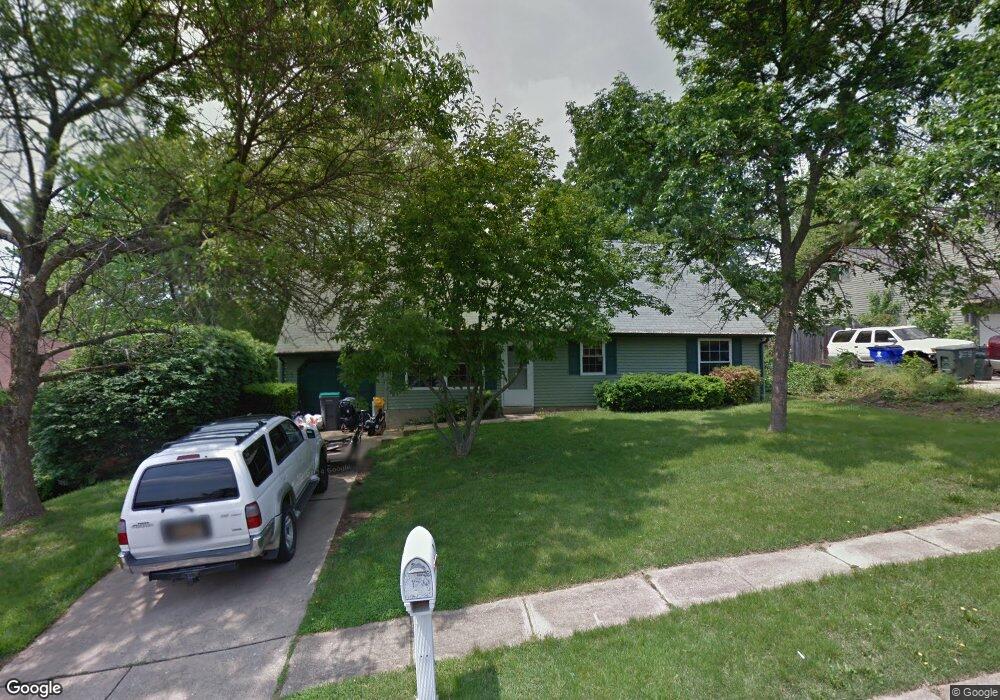
3 Christopher Ct Claymont, DE 19703
Estimated Value: $411,000 - $453,000
4
Beds
2
Baths
2,325
Sq Ft
$185/Sq Ft
Est. Value
About This Home
This home is located at 3 Christopher Ct, Claymont, DE 19703 and is currently estimated at $431,084, approximately $185 per square foot. 3 Christopher Ct is a home located in New Castle County with nearby schools including Maple Lane Elementary School, Pierre S. Dupont Middle School, and Brandywine High School.
Ownership History
Date
Name
Owned For
Owner Type
Purchase Details
Closed on
Aug 10, 2007
Sold by
Mcbride Mark T and Mcbride Erin
Bought by
Kellum Bradley W and Kellum Jennifer N
Current Estimated Value
Home Financials for this Owner
Home Financials are based on the most recent Mortgage that was taken out on this home.
Original Mortgage
$212,800
Outstanding Balance
$135,147
Interest Rate
6.72%
Mortgage Type
Purchase Money Mortgage
Estimated Equity
$295,937
Purchase Details
Closed on
Sep 2, 2004
Sold by
Fritzsche Edward A
Bought by
Mcbride Mark T and Mcbride Erin
Home Financials for this Owner
Home Financials are based on the most recent Mortgage that was taken out on this home.
Original Mortgage
$191,920
Interest Rate
6.01%
Mortgage Type
New Conventional
Create a Home Valuation Report for This Property
The Home Valuation Report is an in-depth analysis detailing your home's value as well as a comparison with similar homes in the area
Home Values in the Area
Average Home Value in this Area
Purchase History
| Date | Buyer | Sale Price | Title Company |
|---|---|---|---|
| Kellum Bradley W | $266,000 | None Available | |
| Mcbride Mark T | $239,900 | -- |
Source: Public Records
Mortgage History
| Date | Status | Borrower | Loan Amount |
|---|---|---|---|
| Open | Kellum Bradley W | $212,800 | |
| Previous Owner | Mcbride Mark T | $191,920 |
Source: Public Records
Tax History
| Year | Tax Paid | Tax Assessment Tax Assessment Total Assessment is a certain percentage of the fair market value that is determined by local assessors to be the total taxable value of land and additions on the property. | Land | Improvement |
|---|---|---|---|---|
| 2024 | $2,984 | $75,700 | $13,600 | $62,100 |
| 2023 | $2,738 | $75,700 | $13,600 | $62,100 |
| 2022 | $2,767 | $75,700 | $13,600 | $62,100 |
| 2021 | $2,764 | $75,700 | $13,600 | $62,100 |
| 2020 | $2,758 | $75,700 | $13,600 | $62,100 |
| 2019 | $3,380 | $75,700 | $13,600 | $62,100 |
| 2018 | $2,647 | $75,700 | $13,600 | $62,100 |
| 2017 | $2,608 | $75,700 | $13,600 | $62,100 |
| 2016 | $2,592 | $75,700 | $13,600 | $62,100 |
| 2015 | $2,393 | $75,700 | $13,600 | $62,100 |
| 2014 | $2,394 | $75,700 | $13,600 | $62,100 |
Source: Public Records
Map
Nearby Homes
- 2520 Reynolds Ave
- 506 Harvey Rd
- 43 Benning Rd
- 502 Delancey Dr
- 307 New York Ave
- 104 Danforth Place
- 4 Lower Greenbriar Rd
- 3037 W Court Ave
- 1602 Harvey Rd
- 3047 4th Ave
- 120 Hilldale Ct
- 2203 Philadelphia Pike
- 201 Clayton Ave
- 1717 Pennrock Rd
- 2103 Lincoln Ave
- 126 S Shelley Dr
- 52 Lawson Ave
- 50 Lawson Ave
- 303 Wyoming Ave
- 102 Laurel Ave
Your Personal Tour Guide
Ask me questions while you tour the home.