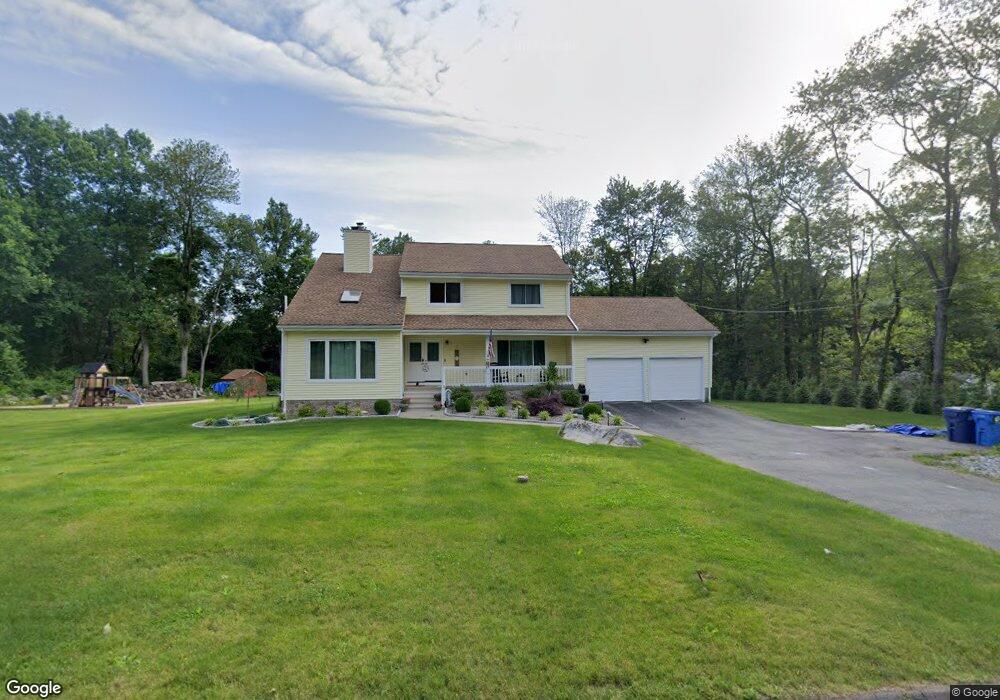
3 Chuse Dr Seymour, CT 06483
Estimated Value: $517,000 - $630,000
3
Beds
3
Baths
2,145
Sq Ft
$272/Sq Ft
Est. Value
About This Home
This home is located at 3 Chuse Dr, Seymour, CT 06483 and is currently estimated at $583,286, approximately $271 per square foot. 3 Chuse Dr is a home located in New Haven County with nearby schools including Bungay Elementary School, Seymour Middle School, and Seymour High School.
Ownership History
Date
Name
Owned For
Owner Type
Purchase Details
Closed on
Jun 16, 2023
Sold by
Brown Kevin W and Brown Alissa
Bought by
Pires Joseph and Olenoski Jenna
Current Estimated Value
Home Financials for this Owner
Home Financials are based on the most recent Mortgage that was taken out on this home.
Original Mortgage
$360,000
Outstanding Balance
$348,745
Interest Rate
6.35%
Mortgage Type
Purchase Money Mortgage
Estimated Equity
$234,541
Purchase Details
Closed on
Oct 11, 2016
Sold by
Orazitti Joseph and Orazietti Marianne
Bought by
Brown Kevin and Brown Alissa
Home Financials for this Owner
Home Financials are based on the most recent Mortgage that was taken out on this home.
Original Mortgage
$31,740
Interest Rate
3.43%
Mortgage Type
New Conventional
Create a Home Valuation Report for This Property
The Home Valuation Report is an in-depth analysis detailing your home's value as well as a comparison with similar homes in the area
Home Values in the Area
Average Home Value in this Area
Purchase History
| Date | Buyer | Sale Price | Title Company |
|---|---|---|---|
| Pires Joseph | $510,000 | None Available | |
| Pires Joseph | $510,000 | None Available | |
| Brown Kevin | $310,000 | -- | |
| Brown Kevin | $310,000 | -- |
Source: Public Records
Mortgage History
| Date | Status | Borrower | Loan Amount |
|---|---|---|---|
| Open | Pires Joseph | $360,000 | |
| Closed | Pires Joseph | $360,000 | |
| Previous Owner | Brown Kevin | $31,740 |
Source: Public Records
Tax History
| Year | Tax Paid | Tax Assessment Tax Assessment Total Assessment is a certain percentage of the fair market value that is determined by local assessors to be the total taxable value of land and additions on the property. | Land | Improvement |
|---|---|---|---|---|
| 2025 | $8,794 | $317,240 | $60,130 | $257,110 |
| 2024 | $8,059 | $218,750 | $60,620 | $158,130 |
| 2023 | $7,871 | $218,750 | $60,620 | $158,130 |
| 2022 | $7,785 | $218,750 | $60,620 | $158,130 |
| 2021 | $7,593 | $218,750 | $60,620 | $158,130 |
| 2020 | $7,464 | $207,340 | $71,120 | $136,220 |
| 2019 | $7,464 | $207,340 | $71,120 | $136,220 |
| 2018 | $7,464 | $207,340 | $71,120 | $136,220 |
| 2017 | $7,464 | $207,340 | $71,120 | $136,220 |
| 2016 | $7,464 | $207,340 | $71,120 | $136,220 |
| 2015 | $7,533 | $217,770 | $78,120 | $139,650 |
| 2014 | $7,413 | $217,770 | $78,120 | $139,650 |
Source: Public Records
Map
Nearby Homes
- 22 Frances Dr
- 75 Balance Rock Rd Unit 20
- 42 Greenwood Cir
- 57 Balance Rock Rd Unit 17
- 215 Meadow Brook Rd Unit 215
- 41 Balance Rock Rd Unit 16
- 43 Balance Rock Rd Unit 1
- 312 Spruce Hill Dr
- 93 Balance Rock Rd Unit 1
- 29 Balance Rock Rd Unit 5
- 151 Great Hill Rd
- 22 Greenwood Cir
- 37-14, 49-1, 79-2, 7 Balance Rock Rd
- 11 Oxford Rd
- 11 Poplar Dr
- 68 New St
- 30 Fairfield Rd
- 0 Hill East Rd Unit 24131331
- 67 Micko Dr
- 69 Micko Dr
Your Personal Tour Guide
Ask me questions while you tour the home.