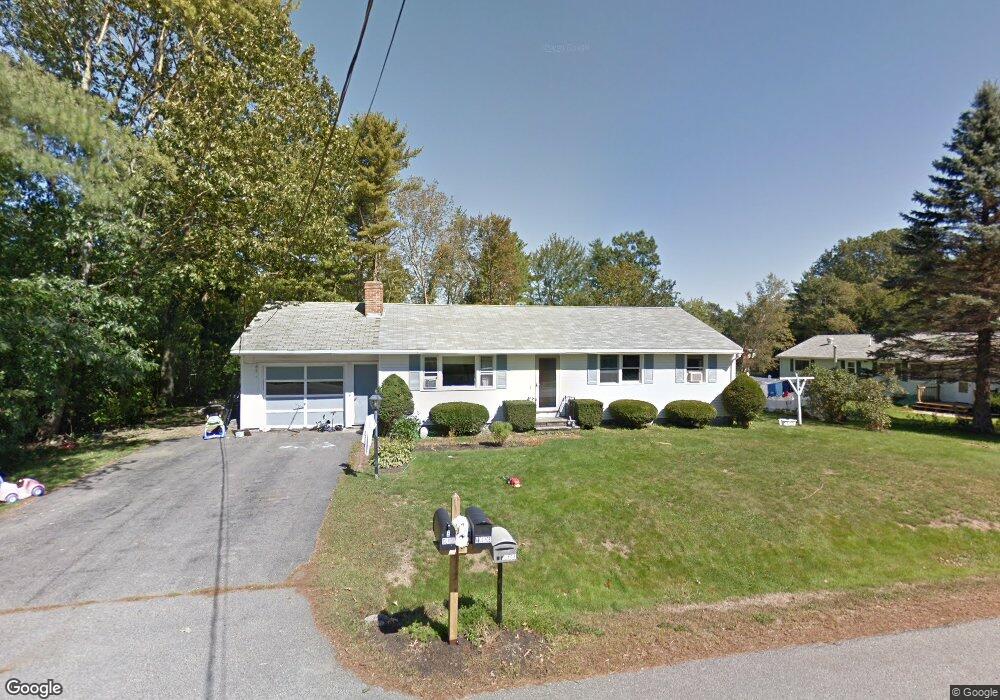
3 Clyde Rd York, ME 03909
York NeighborhoodEstimated Value: $504,000 - $579,000
3
Beds
2
Baths
1,350
Sq Ft
$406/Sq Ft
Est. Value
About This Home
This home is located at 3 Clyde Rd, York, ME 03909 and is currently estimated at $548,161, approximately $406 per square foot. 3 Clyde Rd is a home located in York County with nearby schools including Village Elementary School, Coastal Ridge Elementary School, and York Middle School.
Ownership History
Date
Name
Owned For
Owner Type
Purchase Details
Closed on
Nov 15, 2021
Sold by
Fletcher Matthew and Fletcher Rebekah
Bought by
Fletcher Matthew and Fletcher Rebekah
Current Estimated Value
Home Financials for this Owner
Home Financials are based on the most recent Mortgage that was taken out on this home.
Original Mortgage
$69,500
Interest Rate
3.45%
Mortgage Type
Purchase Money Mortgage
Create a Home Valuation Report for This Property
The Home Valuation Report is an in-depth analysis detailing your home's value as well as a comparison with similar homes in the area
Home Values in the Area
Average Home Value in this Area
Purchase History
| Date | Buyer | Sale Price | Title Company |
|---|---|---|---|
| Fletcher Matthew | -- | None Available | |
| Fletcher Matthew | -- | None Available | |
| Fletcher Matthew | -- | None Available |
Source: Public Records
Mortgage History
| Date | Status | Borrower | Loan Amount |
|---|---|---|---|
| Previous Owner | Fletcher Matthew | $69,500 |
Source: Public Records
Tax History Compared to Growth
Tax History
| Year | Tax Paid | Tax Assessment Tax Assessment Total Assessment is a certain percentage of the fair market value that is determined by local assessors to be the total taxable value of land and additions on the property. | Land | Improvement |
|---|---|---|---|---|
| 2024 | $3,621 | $431,100 | $168,400 | $262,700 |
| 2023 | $3,274 | $387,500 | $124,800 | $262,700 |
| 2022 | $3,169 | $370,700 | $124,800 | $245,900 |
| 2021 | $3,105 | $312,100 | $106,000 | $206,100 |
| 2020 | $2,971 | $267,700 | $106,000 | $161,700 |
| 2019 | $2,813 | $252,300 | $99,800 | $152,500 |
| 2018 | $1,324 | $235,200 | $84,200 | $151,000 |
| 2017 | $3,733 | $232,300 | $84,200 | $148,100 |
| 2016 | $2,416 | $216,700 | $68,600 | $148,100 |
| 2015 | $2,377 | $216,100 | $68,600 | $147,500 |
| 2014 | $2,326 | $217,400 | $68,600 | $148,800 |
| 2013 | $2,267 | $217,400 | $68,600 | $148,800 |
Source: Public Records
Map
Nearby Homes
- 12 Malcolm Rd
- 2 Lils Alley
- 5 Gowen Ln
- 49 Betty Welch Rd
- 4 Fall Mill Rd
- 10 Colony Way
- 8 Colony Way
- 14 Colony Way
- 20 Colony Way
- 3 Shaws Farm Ln Unit 1
- 31 Birch Hill Rd
- 9 Jeffrey Dr
- 75 Caincrest Rd
- 3 Sandalwood Cir
- 11 Orchard Farm Rd
- 16 Orchard Farm Rd
- 11 Chestnut Ln
- 24 Regency Cir Unit 3
- 3 Long Cove Rd
- 7 Blackberry Place