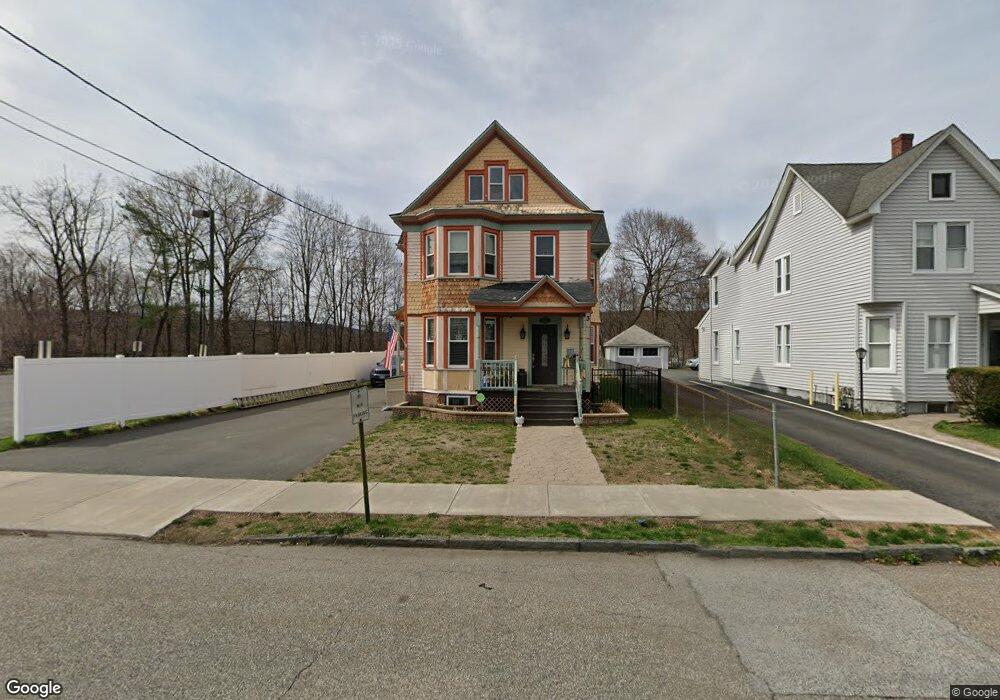
3 Cole St Port Jervis, NY 12771
Estimated Value: $379,000 - $440,973
4
Beds
2
Baths
3,376
Sq Ft
$120/Sq Ft
Est. Value
About This Home
This home is located at 3 Cole St, Port Jervis, NY 12771 and is currently estimated at $403,743, approximately $119 per square foot. 3 Cole St is a home located in Orange County with nearby schools including Port Jervis High School.
Ownership History
Date
Name
Owned For
Owner Type
Purchase Details
Closed on
Jan 4, 2023
Sold by
Eidlisz Rivka and Spitzer Jacob
Bought by
Spitzer Jacob
Current Estimated Value
Purchase Details
Closed on
Sep 3, 2019
Sold by
Holt Daniel T and Holt Nora M
Bought by
Oliver Jonathan and Schreiner Stephen
Purchase Details
Closed on
Jan 14, 2019
Sold by
Myers Michael
Bought by
Myers Michael A and Myers Donna M
Purchase Details
Closed on
Oct 14, 2014
Sold by
Bruce Fowler Llc
Bought by
Myers Michael
Purchase Details
Closed on
Sep 6, 2014
Sold by
Niles William
Bought by
Bruce Fowler Llc
Purchase Details
Closed on
Dec 17, 2013
Sold by
City Of Port Jervis
Bought by
Bruce Fowler Llc
Purchase Details
Closed on
Feb 10, 2005
Sold by
Niles William As Admin Of The Estateof Sonja
Bought by
Niles William
Purchase Details
Closed on
Dec 14, 1999
Sold by
Bariletti Heather Jene and Niles Heather Jene
Bought by
Niles Sonia A
Create a Home Valuation Report for This Property
The Home Valuation Report is an in-depth analysis detailing your home's value as well as a comparison with similar homes in the area
Home Values in the Area
Average Home Value in this Area
Purchase History
| Date | Buyer | Sale Price | Title Company |
|---|---|---|---|
| Spitzer Jacob | -- | None Available | |
| Oliver Jonathan | $335,000 | -- | |
| Myers Michael A | -- | -- | |
| Myers Michael A | -- | -- | |
| Myers Michael A | -- | -- | |
| Myers Michael | $28,000 | None | |
| Myers Michael | $28,000 | None | |
| Bruce Fowler Llc | $1,500 | William Onofry | |
| Bruce Fowler Llc | $1,500 | William Onofry | |
| Bruce Fowler Llc | $11,217 | William Onofry | |
| Bruce Fowler Llc | $11,217 | William Onofry | |
| Niles William | -- | Gurda Law Office | |
| Niles William | -- | Gurda Law Office | |
| Niles Sonia A | -- | Commonwealth Land Title Ins | |
| Niles Sonia A | -- | Commonwealth Land Title Ins |
Source: Public Records
Tax History Compared to Growth
Tax History
| Year | Tax Paid | Tax Assessment Tax Assessment Total Assessment is a certain percentage of the fair market value that is determined by local assessors to be the total taxable value of land and additions on the property. | Land | Improvement |
|---|---|---|---|---|
| 2024 | $6,102 | $85,000 | $6,075 | $78,925 |
| 2023 | $6,102 | $85,000 | $6,075 | $78,925 |
| 2022 | $7,609 | $85,000 | $6,075 | $78,925 |
| 2021 | $6,750 | $85,000 | $6,075 | $78,925 |
| 2020 | $6,922 | $85,000 | $6,075 | $78,925 |
| 2019 | $453 | $85,000 | $6,075 | $78,925 |
| 2018 | $4,554 | $45,550 | $6,075 | $39,475 |
| 2017 | $3,583 | $45,550 | $6,075 | $39,475 |
| 2016 | $4,652 | $45,550 | $6,075 | $39,475 |
| 2015 | -- | $45,550 | $6,075 | $39,475 |
| 2014 | -- | $45,550 | $6,075 | $39,475 |
Source: Public Records
Map
Nearby Homes
- 189 E Main St
- 109 US Highway 6
- 172 Front St Unit 172
- 142 Ball St
- 165 Front St
- 120 Jersey Ave
- 138 Front St Unit 140
- 1 High St
- 115 Hammond St
- 131 Front St
- 178-180 Ball St
- 9 Neversink Dr
- 11 Neversink Dr
- 122 Front St
- 10 Neversink Dr
- 9 Carpenter Rd
- 39 Church St Unit 3
- 39 Church St Unit 22
- 39 Church St Unit 53
- 39 Church St Unit 4
- 1 Cole St
- 167 E Main St
- 186 Ball St
- 172 E Main St
- 184 Ball St
- 178 E Main St
- 178 E Main St Unit 2
- 176 E Main St Unit B19
- 94-A E Main St
- 94 E Main St
- 182 Ball St
- 27 Owen St
- 180 Ball St
- 13-19 Cole St Unit A13
- 13-19 Cole St Unit A21
- 13-19 Cole St Unit B23
- 13 Cole St
- 13-19 Cole St Unit A23
- 13-19 Cole St Unit A12
- 13-19 Cole St Unit B24