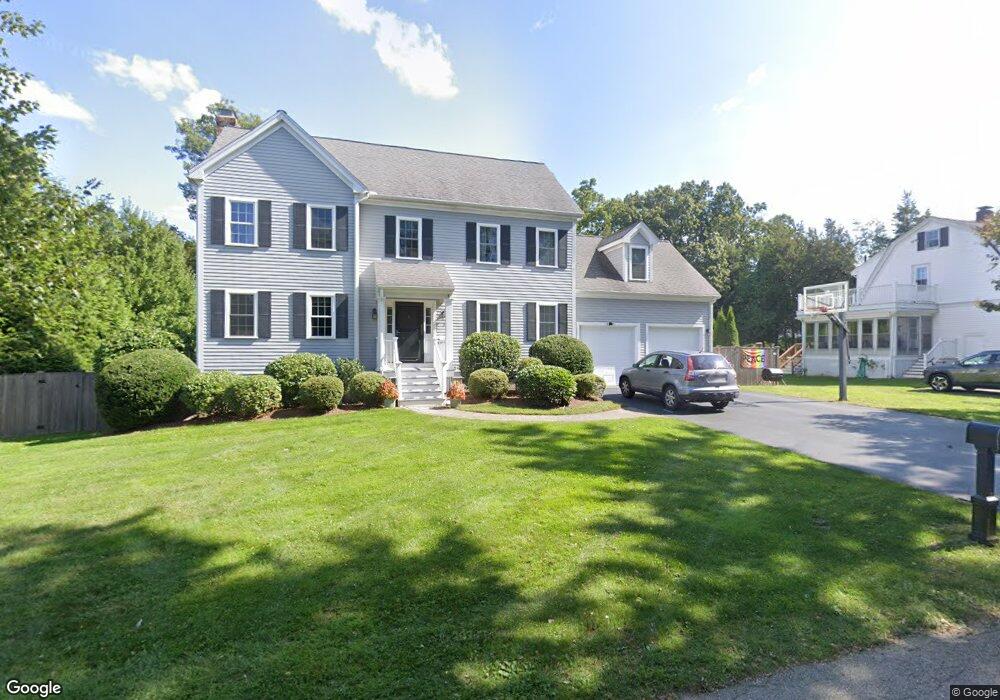
3 Craigie St Natick, MA 01760
Estimated Value: $1,356,494 - $1,626,000
4
Beds
4
Baths
3,000
Sq Ft
$492/Sq Ft
Est. Value
About This Home
This home is located at 3 Craigie St, Natick, MA 01760 and is currently estimated at $1,476,374, approximately $492 per square foot. 3 Craigie St is a home located in Middlesex County with nearby schools including Natick High School, Memorial Elementary School, and J F Kennedy Middle School.
Ownership History
Date
Name
Owned For
Owner Type
Purchase Details
Closed on
Aug 6, 2010
Sold by
B & B Land Corp
Bought by
Rogers Mitchell J and Rogers Punam S
Current Estimated Value
Home Financials for this Owner
Home Financials are based on the most recent Mortgage that was taken out on this home.
Original Mortgage
$700,000
Outstanding Balance
$467,193
Interest Rate
4.73%
Mortgage Type
Purchase Money Mortgage
Estimated Equity
$1,009,181
Purchase Details
Closed on
Apr 15, 2010
Sold by
Hall Jerome J and Hall Peter
Bought by
B & B Land Corp
Home Financials for this Owner
Home Financials are based on the most recent Mortgage that was taken out on this home.
Original Mortgage
$1,000,000
Interest Rate
4.97%
Mortgage Type
Purchase Money Mortgage
Create a Home Valuation Report for This Property
The Home Valuation Report is an in-depth analysis detailing your home's value as well as a comparison with similar homes in the area
Home Values in the Area
Average Home Value in this Area
Purchase History
| Date | Buyer | Sale Price | Title Company |
|---|---|---|---|
| Rogers Mitchell J | $300,000 | -- | |
| B & B Land Corp | $1,120,000 | -- |
Source: Public Records
Mortgage History
| Date | Status | Borrower | Loan Amount |
|---|---|---|---|
| Open | Rogers Mitchell J | $700,000 | |
| Previous Owner | B & B Land Corp | $1,000,000 |
Source: Public Records
Tax History Compared to Growth
Tax History
| Year | Tax Paid | Tax Assessment Tax Assessment Total Assessment is a certain percentage of the fair market value that is determined by local assessors to be the total taxable value of land and additions on the property. | Land | Improvement |
|---|---|---|---|---|
| 2025 | $13,272 | $1,109,700 | $462,400 | $647,300 |
| 2024 | $12,888 | $1,051,200 | $436,700 | $614,500 |
| 2023 | $12,040 | $952,500 | $409,900 | $542,600 |
| 2022 | $11,654 | $873,600 | $373,000 | $500,600 |
| 2021 | $11,179 | $821,400 | $352,600 | $468,800 |
| 2020 | $10,971 | $806,100 | $337,300 | $468,800 |
| 2019 | $10,246 | $806,100 | $337,300 | $468,800 |
| 2018 | $10,520 | $806,100 | $321,900 | $484,200 |
| 2017 | $10,283 | $762,300 | $286,900 | $475,400 |
| 2016 | $10,146 | $747,700 | $276,800 | $470,900 |
| 2015 | $9,754 | $705,800 | $276,800 | $429,000 |
Source: Public Records
Map
Nearby Homes
- 10 Sundance Way
- 5 Deer Path
- 94 Woodland St
- 11 Avon St
- 6 Ambler Ct
- 8 Floral Ave Unit 8
- 39 Davis Brook Dr
- 21 Harvest Moon Dr
- 15 Church St Unit 3
- 48 S Main St Unit 7
- 8 Floral Avenue Extension
- 216-218 S Main St
- 6B Lincoln St Unit 6B
- 5 Wilson St Unit 5A
- 48 Graystone Ln
- 4B Lincoln St Unit 4B
- 15 Penobscot Rd
- 3 Wilson St Unit 3B
- 67 E Central St & 5 Union St
- 47 High St