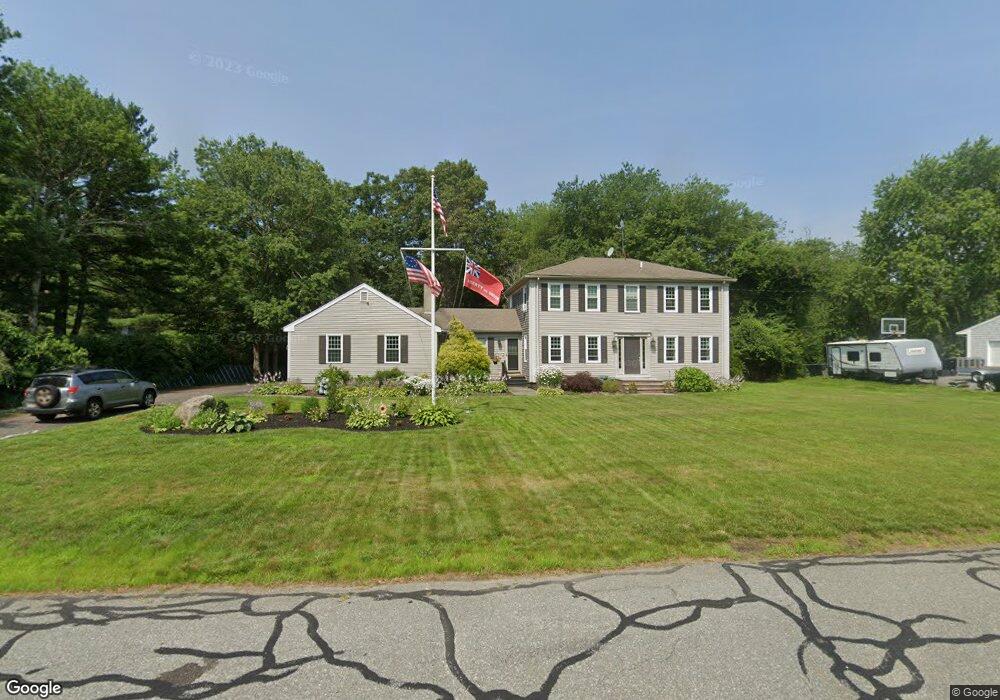
3 Crescent Dr North Dartmouth, MA 02747
North Apponagansett NeighborhoodEstimated Value: $666,895 - $827,000
4
Beds
3
Baths
2,366
Sq Ft
$316/Sq Ft
Est. Value
About This Home
This home is located at 3 Crescent Dr, North Dartmouth, MA 02747 and is currently estimated at $747,474, approximately $315 per square foot. 3 Crescent Dr is a home located in Bristol County with nearby schools including Dartmouth High School, Friends Academy, and Our Sister's School.
Ownership History
Date
Name
Owned For
Owner Type
Purchase Details
Closed on
May 20, 2005
Sold by
Arsenault Jean C
Bought by
Theriault Jody L and Theriault Mark L
Current Estimated Value
Purchase Details
Closed on
Apr 20, 1994
Sold by
Fiske George W and Fiske Janice B
Bought by
Arsenault Stephen F and Arsenault Jean C
Create a Home Valuation Report for This Property
The Home Valuation Report is an in-depth analysis detailing your home's value as well as a comparison with similar homes in the area
Home Values in the Area
Average Home Value in this Area
Purchase History
| Date | Buyer | Sale Price | Title Company |
|---|---|---|---|
| Theriault Jody L | $450,000 | -- | |
| Arsenault Stephen F | $229,000 | -- |
Source: Public Records
Mortgage History
| Date | Status | Borrower | Loan Amount |
|---|---|---|---|
| Open | Arsenault Stephen F | $20,000 | |
| Open | Arsenault Stephen F | $494,000 | |
| Closed | Arsenault Stephen F | $464,361 |
Source: Public Records
Tax History Compared to Growth
Tax History
| Year | Tax Paid | Tax Assessment Tax Assessment Total Assessment is a certain percentage of the fair market value that is determined by local assessors to be the total taxable value of land and additions on the property. | Land | Improvement |
|---|---|---|---|---|
| 2025 | $4,680 | $517,100 | $182,100 | $335,000 |
| 2024 | $4,622 | $505,700 | $182,100 | $323,600 |
| 2023 | $4,553 | $469,900 | $167,800 | $302,100 |
| 2022 | $4,267 | $411,900 | $167,800 | $244,100 |
| 2021 | $4,071 | $375,900 | $148,900 | $227,000 |
| 2020 | $4,155 | $381,900 | $155,900 | $226,000 |
| 2019 | $3,940 | $363,100 | $144,800 | $218,300 |
| 2018 | $6,197 | $346,600 | $144,800 | $201,800 |
| 2017 | $3,614 | $339,700 | $141,900 | $197,800 |
| 2016 | $3,714 | $351,000 | $155,100 | $195,900 |
| 2015 | $3,532 | $336,100 | $137,500 | $198,600 |
| 2014 | $3,422 | $327,800 | $133,600 | $194,200 |
Source: Public Records
Map
Nearby Homes
- 24 Wayne Memorial Dr
- 6 Strathmore Rd
- 219 Chase Rd
- 10 Westview Dr
- 14 Westview Dr
- 38 Gibson Terrace
- 29 Elizabeth Ct
- 135 Old Westport Rd
- Lot 6 Rafael Rd
- 46 Old Westport Rd
- 33 Rosewood Terrace
- 25 Westwood Dr
- 73 Gifford Ave
- 1406 Tucker Rd
- 6 Jacob Dr
- 5 Samosett Dr
- 0 Victoria St Unit 73457953
- 360 Russells Mills Rd
- 3 Mishawum Dr
- 6 Walters Way
- 5 Crescent Dr
- 8 Country Club Blvd
- 10 Country Club Blvd
- 4 Crescent Dr
- 12 Country Club Blvd
- 2 Crescent Dr
- 7 Crescent Dr
- 14 Country Club Blvd
- 8 Crescent Dr
- 9 Crescent Dr
- 990 Tucker Rd
- 1000 Tucker Rd
- 984 Tucker Rd
- 984 Tucker Rd Unit 1
- 1010 Tucker Rd
- 0 Country Club Blvd Unit 71085607
- 0 Country Club Blvd Unit 71268280
- 1014 Tucker Rd
- 16 Country Club Blvd
- 10 Crescent Dr