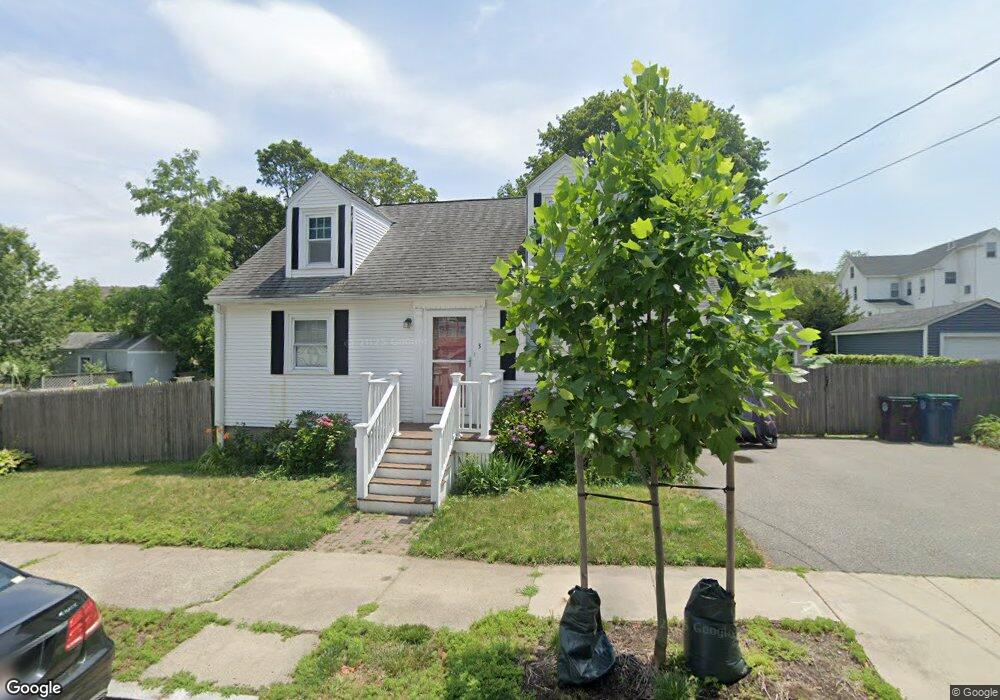
3 Cressey Ave Salem, MA 01970
North Salem NeighborhoodEstimated Value: $612,000 - $621,958
3
Beds
1
Bath
1,238
Sq Ft
$499/Sq Ft
Est. Value
About This Home
This home is located at 3 Cressey Ave, Salem, MA 01970 and is currently estimated at $617,240, approximately $498 per square foot. 3 Cressey Ave is a home located in Essex County with nearby schools including Bates Elementary School, Saltonstall School, and Carlton Elementary School.
Ownership History
Date
Name
Owned For
Owner Type
Purchase Details
Closed on
Apr 25, 2006
Sold by
Gc Rt
Bought by
Rowen Joshua R
Current Estimated Value
Home Financials for this Owner
Home Financials are based on the most recent Mortgage that was taken out on this home.
Original Mortgage
$260,000
Interest Rate
6.37%
Mortgage Type
Purchase Money Mortgage
Create a Home Valuation Report for This Property
The Home Valuation Report is an in-depth analysis detailing your home's value as well as a comparison with similar homes in the area
Home Values in the Area
Average Home Value in this Area
Purchase History
| Date | Buyer | Sale Price | Title Company |
|---|---|---|---|
| Rowen Joshua R | $325,000 | -- |
Source: Public Records
Mortgage History
| Date | Status | Borrower | Loan Amount |
|---|---|---|---|
| Open | Rowen Joshua R | $240,000 | |
| Closed | Rowen Joshua R | $254,000 | |
| Closed | Rowen Joshua R | $260,000 | |
| Closed | Rowen Joshua R | $32,500 |
Source: Public Records
Tax History Compared to Growth
Tax History
| Year | Tax Paid | Tax Assessment Tax Assessment Total Assessment is a certain percentage of the fair market value that is determined by local assessors to be the total taxable value of land and additions on the property. | Land | Improvement |
|---|---|---|---|---|
| 2025 | $5,964 | $525,900 | $209,300 | $316,600 |
| 2024 | $5,833 | $502,000 | $198,900 | $303,100 |
| 2023 | $5,640 | $450,800 | $183,600 | $267,200 |
| 2022 | $5,504 | $415,400 | $177,500 | $237,900 |
| 2021 | $5,135 | $372,100 | $165,200 | $206,900 |
| 2020 | $5,125 | $354,700 | $156,000 | $198,700 |
| 2019 | $5,098 | $337,600 | $148,100 | $189,500 |
| 2018 | $4,875 | $317,000 | $140,700 | $176,300 |
| 2017 | $4,347 | $274,100 | $118,700 | $155,400 |
| 2016 | $4,209 | $268,600 | $113,200 | $155,400 |
| 2015 | $4,071 | $248,100 | $104,000 | $144,100 |
Source: Public Records
Map
Nearby Homes
- 16 1/2 Symonds St
- 170 North St
- 5 Woodside St Unit 5-1
- 8 Cushing St Unit 2
- 5 School St Unit 6
- 143 North St Unit 2
- 52 Dunlap St
- 144 North St
- 138 North St Unit B
- 43 Irving St
- 14 Margin St
- 112 North St
- 41 Dearborn St
- 78 Northend St
- 3 S Mason St
- 9 Shamrock St
- 6 Englewood Rd
- 8 Beachmont Rd
- 18 Franklin St Unit 303
- 18 Franklin St Unit 402
- 191 North St
- 12 Northend Ave
- 5 Cressey Ave
- 8 Northend Ave
- 8 Northend Ave Unit 1
- 16 Northend Ave
- 193 North St
- 6 Cressey Ave
- 4 Cressey Ave
- 189 North St
- 189 North St Unit 1
- 189 North St Unit 209
- 187 North St
- 193 1/2 North St
- 18 Northend Ave
- 8 Cressey Ave
- 9 Cressey Ave
- 195 North St
- 195 North St Unit 2
- 185 North St