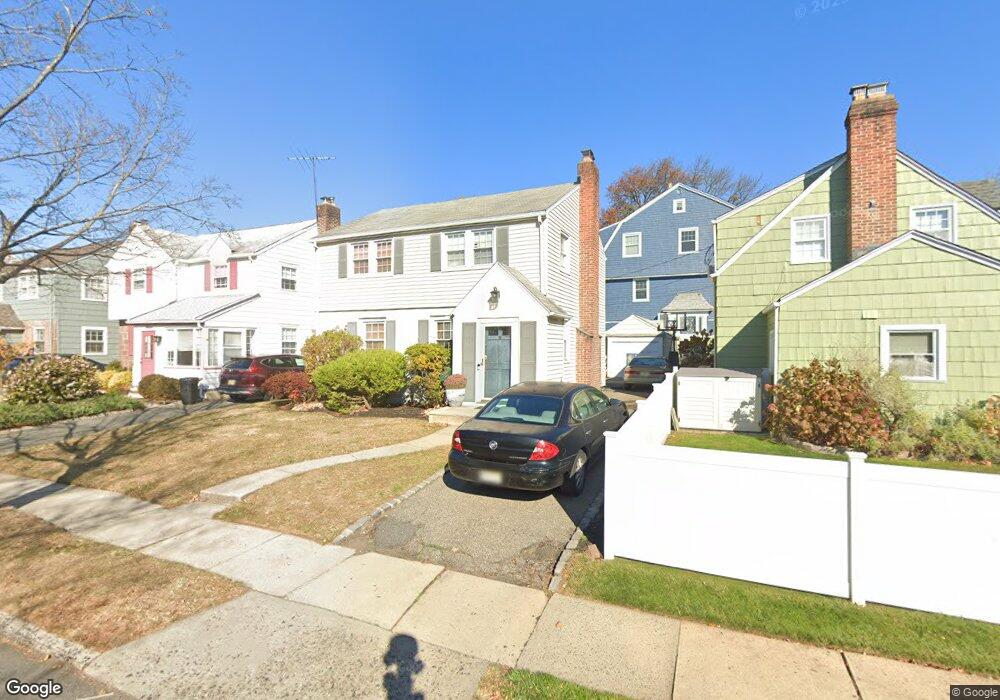
3 Cross Place Glen Ridge, NJ 07028
Estimated Value: $723,931 - $898,000
--
Bed
--
Bath
1,287
Sq Ft
$618/Sq Ft
Est. Value
About This Home
This home is located at 3 Cross Place, Glen Ridge, NJ 07028 and is currently estimated at $795,733, approximately $618 per square foot. 3 Cross Place is a home located in Essex County with nearby schools including Linden Avenue Elementary School, Ridgewood Avenue School, and Glen Ridge High School.
Ownership History
Date
Name
Owned For
Owner Type
Purchase Details
Closed on
Jul 21, 2004
Sold by
Quinones Dennis
Bought by
Samuels Frank and Samuels Amy Arthur
Current Estimated Value
Home Financials for this Owner
Home Financials are based on the most recent Mortgage that was taken out on this home.
Original Mortgage
$53,600
Outstanding Balance
$26,743
Interest Rate
6.2%
Estimated Equity
$768,990
Purchase Details
Closed on
Sep 19, 2001
Purchase Details
Closed on
Mar 9, 2000
Sold by
Glancy Eugene
Bought by
Matos Glayness
Home Financials for this Owner
Home Financials are based on the most recent Mortgage that was taken out on this home.
Original Mortgage
$193,400
Interest Rate
8.31%
Mortgage Type
FHA
Purchase Details
Closed on
Jan 10, 1994
Sold by
Glancy Marie
Bought by
Glancy Eugene
Home Financials for this Owner
Home Financials are based on the most recent Mortgage that was taken out on this home.
Original Mortgage
$140,000
Interest Rate
7.08%
Create a Home Valuation Report for This Property
The Home Valuation Report is an in-depth analysis detailing your home's value as well as a comparison with similar homes in the area
Home Values in the Area
Average Home Value in this Area
Purchase History
| Date | Buyer | Sale Price | Title Company |
|---|---|---|---|
| Samuels Frank | $358,000 | -- | |
| -- | -- | -- | |
| Matos Glayness | $195,000 | -- | |
| Glancy Eugene | $160,000 | -- |
Source: Public Records
Mortgage History
| Date | Status | Borrower | Loan Amount |
|---|---|---|---|
| Open | Samuels Frank | $53,600 | |
| Previous Owner | Matos Glayness | $193,400 | |
| Previous Owner | Glancy Eugene | $140,000 |
Source: Public Records
Tax History Compared to Growth
Tax History
| Year | Tax Paid | Tax Assessment Tax Assessment Total Assessment is a certain percentage of the fair market value that is determined by local assessors to be the total taxable value of land and additions on the property. | Land | Improvement |
|---|---|---|---|---|
| 2025 | $14,221 | $421,500 | $259,200 | $162,300 |
| 2024 | $14,221 | $421,500 | $259,200 | $162,300 |
| 2022 | $13,880 | $421,500 | $259,200 | $162,300 |
| 2021 | $13,081 | $403,100 | $259,200 | $143,900 |
| 2020 | $12,557 | $394,000 | $259,200 | $134,800 |
| 2019 | $12,179 | $394,000 | $259,200 | $134,800 |
| 2018 | $11,838 | $320,900 | $208,800 | $112,100 |
| 2017 | $11,575 | $320,900 | $208,800 | $112,100 |
| 2016 | $11,244 | $320,900 | $208,800 | $112,100 |
| 2015 | $10,994 | $320,900 | $208,800 | $112,100 |
| 2014 | $10,824 | $320,900 | $208,800 | $112,100 |
Source: Public Records
Map
Nearby Homes
- 14 Ridgewood Ave
- 7 Cross Place
- 11 Cross Place
- 18 Ridgewood Ave
- 15 Cross Place
- 4 Cross Place
- 21 Willow St
- 10 Ridgewood Ave
- 8 Cross Place
- 19 Willow St
- 12 Cross Place
- 20 Ridgewood Ave
- 23 Willow St
- 13 Ridgewood Ave
- 11 Ridgewood Ave
- 15 Ridgewood Ave
- 25 Willow St
- 16 Cross Place
- 9 Ridgewood Ave
- 17 Ridgewood Ave