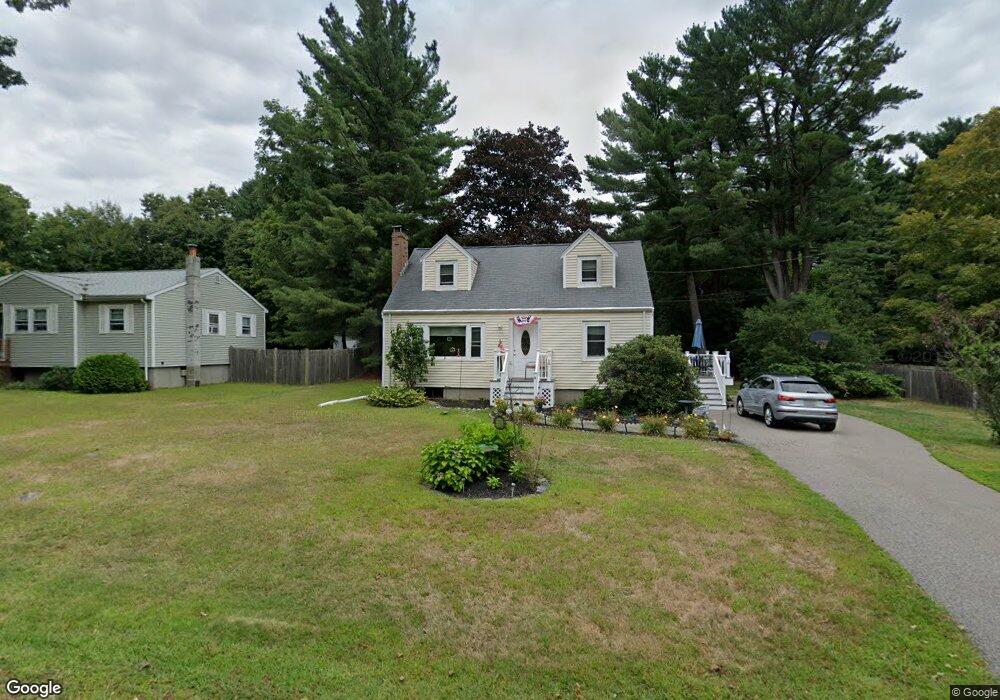
3 Cross St Foxboro, MA 02035
Estimated Value: $553,982 - $705,000
3
Beds
2
Baths
1,152
Sq Ft
$530/Sq Ft
Est. Value
About This Home
This home is located at 3 Cross St, Foxboro, MA 02035 and is currently estimated at $610,746, approximately $530 per square foot. 3 Cross St is a home located in Norfolk County with nearby schools including Foxborough High School, Foxborough Regional Charter School, and The Sage School.
Ownership History
Date
Name
Owned For
Owner Type
Purchase Details
Closed on
May 14, 2024
Sold by
Lyon Carol M
Bought by
C M Lyon Declaration Of T and Lyon
Current Estimated Value
Purchase Details
Closed on
Dec 13, 1985
Bought by
Lyon Thomas J and Lyon Carol M
Create a Home Valuation Report for This Property
The Home Valuation Report is an in-depth analysis detailing your home's value as well as a comparison with similar homes in the area
Home Values in the Area
Average Home Value in this Area
Purchase History
| Date | Buyer | Sale Price | Title Company |
|---|---|---|---|
| C M Lyon Declaration Of T | -- | None Available | |
| C M Lyon Declaration Of T | -- | None Available | |
| Lyon Thomas J | $112,300 | -- |
Source: Public Records
Mortgage History
| Date | Status | Borrower | Loan Amount |
|---|---|---|---|
| Previous Owner | Lyon Thomas J | $143,000 | |
| Previous Owner | Lyon Thomas J | $136,000 | |
| Previous Owner | Lyon Thomas J | $7,500 |
Source: Public Records
Tax History
| Year | Tax Paid | Tax Assessment Tax Assessment Total Assessment is a certain percentage of the fair market value that is determined by local assessors to be the total taxable value of land and additions on the property. | Land | Improvement |
|---|---|---|---|---|
| 2025 | $5,954 | $450,400 | $218,000 | $232,400 |
| 2024 | $5,763 | $426,600 | $218,000 | $208,600 |
| 2023 | $5,617 | $395,300 | $207,600 | $187,700 |
| 2022 | $5,503 | $379,000 | $198,600 | $180,400 |
| 2021 | $5,175 | $351,100 | $180,500 | $170,600 |
| 2020 | $5,015 | $344,200 | $180,500 | $163,700 |
| 2019 | $4,717 | $320,900 | $171,900 | $149,000 |
| 2018 | $4,636 | $318,200 | $171,900 | $146,300 |
| 2017 | $4,371 | $290,600 | $160,700 | $129,900 |
| 2016 | $4,366 | $294,600 | $154,600 | $140,000 |
| 2015 | $4,109 | $270,500 | $130,500 | $140,000 |
| 2014 | $4,017 | $268,000 | $128,000 | $140,000 |
Source: Public Records
Map
Nearby Homes
- 6 Cross St
- 5 Post Rd
- 73 Ridge Rd
- 2 Eisenhauer
- 54 Main St Unit A
- 12 Goodwin Dr
- 14 Baker St
- 8 Conway Ln
- 260 Summer St
- 131 Washington St Unit 50
- 75 Foxboro Rd
- 120 Beach St
- 5 Jackson Dr
- 26 Fuller Rd Unit 6
- 147 Chestnut St Unit A
- 147 Chestnut St Unit B
- 84 South St
- 22 Villa Dr
- 25 Foxboro Rd
- 1 Roseland St Unit B-14
Your Personal Tour Guide
Ask me questions while you tour the home.